Download
1 / 7
70 likes | 215 Views
Revised May 2014. Prepared for the 2013 SRI Conference: The Quant's View of ESG Integration. Massachusetts Limited Liability Corporation Registered Investment Advisor based in Boston Primary Custodians: Charles Schwab and FOLIO fn

E N D
Revised May 2014 Prepared for the 2013 SRI Conference: The Quant's View of ESG Integration
Massachusetts Limited Liability Corporation Registered Investment Advisor based in Boston Primary Custodians: Charles Schwab and FOLIOfn Errors and Omissions Insurance - Evanston Insurance Company Directors and Officers Insurance - Evanston Insurance Company Primary data providers – Compustat® and MSCI Large, Mid, and Small cap value, and comparable ESG and SRI products Separate accounts with customized SRI screens available Over $36 million in AUM – 40 institutional and individual investors SEC compliant Jantz Management LLC
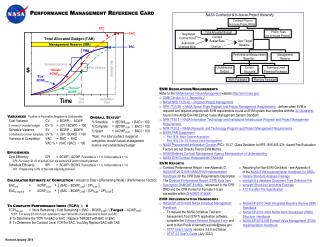
Security Valuation Security Valuation Company Specific Data Market Statistics Long Run Payout Long Run Payout Initial Payout Rate Initial Payout Rate Rate Rate <TIME STEP> <TIME STEP> <DSRT> <DSRT> Payout Rate TC Payout Rate TC <TIME STEP> <TIME STEP> Period Discount Period Discount Rate Rate Forecast Forecast Beginning period Beginning period Payout Rate Payout Rate payout rate payout rate FPR rate of FPR rate of change change Discount Discount <Time> <Time> Factor Factor Accumulation of Accumulation of Plow Back Rate Plow Back Rate <Forecast ROE> <Forecast ROE> PDR PDR ROE ROE Dividends Dividends Earnings Earnings Discounted Discounted Dividends Dividends dividend flow dividend flow Book Value Book Value current current Change in book Change in book Final Payout Final Payout value value <Initial Book Value> <Initial Book Value> <Time> <Time> <FINAL TIME> <FINAL TIME> NPV Dividends & NPV Dividends & <DSRT> <DSRT> Final Payout Final Payout Portfolio Construction Portfolio Construction Security Price 1 1 2 2 3 3 N N 1 1 2 2 3 3 N N Portfolio Management Portfolio Management Buy/Sell Discipline ctx ctx ctx ctx ati ati ati ati ual ual ual ual Optimized Investment Process S&P Index Constituents SYSTEM DYNAMIC MODELS &SIMULATION RISK MODELS, SRI/ESG & OPTIMIZATION Security SRI/ESG Scores MONTHLY PORTFOLIO REBALANCE
Integrated Process Incorporate data from providers… values Clients advocacy portfolios Company JantzManagement information -SEC filings -legal & regulatory -other data -financial -SRI/ESG Data Providers feedback …into actively managed portfolios that reflect our clients’ values.
Stakeholders Needs • Management, Owner (Fiduciary) • Performance—Return and Risk • Organization/Policies—Corporate Governance/Legal/Compensation/ Benefits/Structure • Culture/Behavior—Ethics/ Fairness/Human Rights/Diversity • Sustainability—Innovative and EfficientUse of Resources: Social-/Environmental-/Economic-Capital • Customer • Products—Quality/Value/Innovative/ Safe/Reliable • Services—Quality/Value/Innovative Customer Management, Owner (Fiduciary) • Community • Economic/Tax Base • Environment—Safe/Green/Hazard Free • Community Development—Infrastructure: Schools/Education, Housing, Financial, Transportation, etc. • Employees • Compensation • Benefits—Health, Vacation, Sick Leave • Opportunity—Training/ Promotion • Life Quality—Work-Life Balance, Safety, Hazard Free Community Employees Socially Responsible High Performance Business Stakeholder model identifies company data to collect for ESG measurement systems.
ESG Considerations Can Increase Returns Monthly net returns to the SRI and ESG portfolios significantly outperform monthly total returns to the S&P 600 index (and universe). EXPERIMENTAL DESIGN These portfolios use the same optimized process for portfolio construction, so performance differences among them can be attributed to the SRI and ESG components.
JantzManagement LLC, 470 Atlantic Avenue, 4th Floor, Boston, MA 02210 www.JantzMgmt.com info@JantzMgmt.com 617.273.8018 Disclosures • This presentation does not constitute an offer to sell or a solicitation of an offer to buy any securities and is provided for informational purposes only. • Past performance is not necessarily indicative of future returns, the value of investments and the income derived from them can go down as well as up. Future returns are not guaranteed and a loss of principal may occur. • The material in this presentation is based on information from a variety of sources we consider reliable, but we do not represent that the information is accurate or complete. The material provided herein is for informational purposes only. Source of benchmark total returns: Standard & Poor’s. • Opinions expressed are current opinions as of the date appearing in this material only. • References to market or composite indices, benchmarks or other measures of relative market performance over a specified period of time are provided for your information only. Reference to an index does not imply that a Jantz Management portfolio will achieve returns, volatility or other results similar to the index. The composition of a benchmark index may not reflect the manner in which a Jantz Management portfolio is constructed in relation to expected or achieved returns, investment holdings, portfolio guidelines, restrictions, sectors, correlations, concentrations, volatility or tracking error targets, all of which are subject to change over time. • Portfolio performance, characteristics, volatility, and other data shown were derived from various Jantz Management’s Portfolios. • Total return figures, i.e., performance calculations, are calculated using trade date accounting. All realized and unrealized capital gains and losses as well as all dividends and interest from investments and cash balances are included. Results are presented in United States currency. The performance figures presented are net of brokerage commissions and all other expenses, including the firm’s investment advisory fee. The investment results shown are not necessarily representative of an individually managed account's rate-of-return. • Some performance results for the Jantz Management portfolios referred to herein, and their respective benchmarks, reflect total return figures. That is, their performance includes the reinvestment of dividends, interest and other earnings. Performance results for all periods are time-weighted based on monthly portfolio valuations. • Performance of Jantz Management’s strategies relative to their respective performance benchmark may have been impacted positively or negatively by economic and market conditions which affect either the benchmark or the Jantz Management strategy to a greater or lesser degree. • Jantz Management’s portfolio risk management process includes an effort to monitor and manage risk, but should not be confused with and does not imply low risk. • Weightings of holdings in the portfolios may change at any time without notice subject to the discretion of Jantz Management LLC. • Jantz Management’s portfolios, models, and processes are proprietary and any descriptions provided wherein are for illustrative purposes only, reflecting a particular instantiation of that portfolio, model, or process, which may change at any time without notice subject to the sole discretion of Jantz Management LLC. • Jantz Management LLC does not provide tax advice to its clients. All investors are strongly urged to consult with their tax advisors regarding any potential investment. • This material is not intended to be used as a general guide to investing, or as a source of any specific investment recommendations, and makes no implied or express recommendations concerning the manner in which any client’s account should or would be handled, as appropriate strategies depend upon the client’s specific circumstances and investment objectives. • S&P 500 Index – The S&P 500 is the Standard & Poor’s composite index of 500 stocks, a widely recognized, unmanaged index of common stock prices. • S&P 400 Index – The S&P 400 is the Standard & Poor’s composite index of 400 stocks, a widely recognized, unmanaged index of common stock prices. • S&P 600 Index – The S&P 600 is the Standard & Poor’s composite index of 600 stocks, a widely recognized, unmanaged index of common stock prices. • Volatility (standard deviation) measures the dispersion or uncertainty in a random variable (in this case, investment returns). It measures the degree of variation of returns around the mean or (average) return. The greater the variation of the investment returns, the higher the standard deviation will be. For this reason, standard deviation is often used as one measure of investment risk. A more volatile stock or investment would have a higher standard deviation. • Please refer to Jantz Management’s ADV Part 2A and 2B for more information.