Download
1 / 53
530 likes | 717 Views
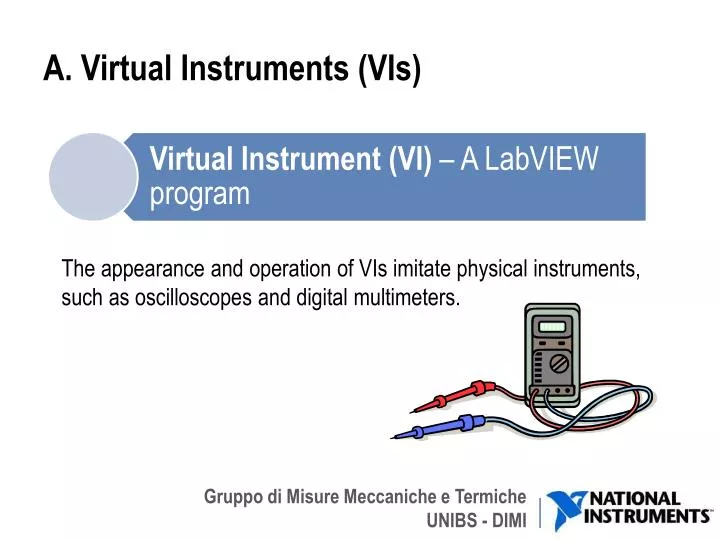
A. Virtual Instruments (VIs). The appearance and operation of VIs imitate physical instruments, such as oscilloscopes and digital multimeters. B. Parts of a VI. LabVIEW VIs contain three main components: 1. Front Panel 2. Block Diagram 3. Icon/Connector Pane.

E N D
A. Virtual Instruments (VIs) The appearance and operation of VIs imitate physical instruments, such as oscilloscopes and digital multimeters.
B. Parts of a VI LabVIEW VIs contain three main components: 1. Front Panel 2. Block Diagram 3. Icon/Connector Pane
B. Parts of a VI – Front Panel You build the front panel with controls (inputs) and indicators (outputs)
B. Parts of a VI – Block Diagram Front panel objects appear as terminals on the block diagram
B. Parts of a VI – Icon/Connector Pane • Icon: graphical representation of a VI • Connector Pane: map of the inputs and outputs of a VI • Icons and connector panes are necessary to use a VI as a subVI • A subVI is a VI that is inside of another VI • Similar to a function in a text-based programming language Icon Connector Pane
E. Front Panel – Controls Palette • Contains the controls and indicators you use to create the front panel • Access from the front panel by selecting View»Controls Palette
E. Front Panel – Controls & Indicators • Controls • Knobs, push buttons, dials, and other input devices • Simulate instrument input devices and supply data to the block diagram of the VI • Indicators • Graphs, LEDs, and other displays • Simulate instrument output devices and display data the block diagram acquires or generates
E. Front Panel – Numeric Controls/Indicators The numeric data type can represent numbers of various types, such as integer or real Numeric Control Increment/Decrement Buttons Numeric Indicator
E. Front Panel – Boolean Controls/Indicators • The Boolean data type represents data that only has two parts, such as True and False or On and Off • Use Boolean controls and indicators to enter and display Boolean (True or False) values • Boolean objects simulate switches, push buttons, and LEDs Boolean Indicator Boolean Control
E. Front Panel – Strings • The string data type is a sequence of ASCII characters • Use string controls to receive text from the user such as a password or user name • Use string indicators to display text to the user
E. Front Panel – Shortcut Menus • All LabVIEW objects have associated shortcut menus • As you create a VI, use the shortcut menu items to change the look or behavior of front panel and block diagram objects • To access the shortcut menu, right-click the object
E. Front Panel – Property Dialog Box • Right-click a front panel object and select Properties to display • The options available on the property dialog box are similar to the options available on the shortcut menu for that object
E. Front Panel – Configure Multiple Objects • Select multiple objects to simultaneously configure shared properties
Configuring Your LabVIEW Environment • Functions Palette • Tack the Functions palette and select Customize»Change Visible Categories then click Select All • Controls Palette • Tack the Controls palette and select Customize»Change Visible Categories then click Select All
Pratice Replicate the followingfrontpanel
F. Block Diagram Block diagram objects include the following: • Terminals • SubVIs • Functions • Constants • Structures • Wires
F. Block Diagram – Terminals • Terminals are: • Block diagram appearance of front panel objects • Entry and exit ports that exchange information between the front panel and block diagram • Analogous to parameters and constants in text-based programming languages • Change the view type of a terminal by toggling the View as Icon selection from the context menu
B. LabVIEW Data Types – Terminals Terminals visually communicate information about the data type represented
F. Block Diagram – Wires • Transfer data between block diagram objects through wires • Wires are different colors, styles, and thicknesses, depending on their data types • A broken wire appears as a dashed black line with a red X in the middle DBL Numeric Integer Numeric String Scalar 1D Array 2D Array
F. Block Diagram – Nodes • Objects on the block diagram that have inputs and/or outputs and perform operations when a VI runs • Analogous to statements, operators, functions, and subroutines in text-based programming languages • Nodes can be functions, subVIs, or structures Nodes
H. Selecting A Tool • Create, modify, and debug VIs using the tools provided by LabVIEW • A tool is a special operating mode of the mouse cursor • The operating mode of the cursor corresponds to the icon of the tool selected • When using the Automatic Tool Selection, LabVIEW chooses which tool to select based on the current location of the mouse
Practice • Look and the block diagram of the previous practice and add the following nodes: • Add • Multiply • Random number • Greater than • Less than • Get date/time in seconds • Then use wires to connect all the elements of the block diagram leaving no terminal unconnected. Target: Simulate a given temperature value, add a randomnoiseofgivenamplitude,then light up analertwhensuch a temperature isgreaterthansetpoint and anotherifislessthansetpoint .
F. Block Diagram – Function Nodes • Fundamental operating elements of LabVIEW • Do not have front panels or block diagrams, but do have connector panes • Double-clicking a function only selects the function – does not open it like a VI • Has a pale yellow background on its icon
F. Block Diagram – SubVI Nodes • SubVI: VIs that you build to use inside of another VI • Any VI has the potential to be used as a subVI • When you double-click a subVI on the block diagram, you can view the front panel and block diagram of the subVI • The upper right corner of the front panel and block diagram displays the icon for the current VI • This is the icon that appears when you place the VI on a block diagram as a subVI
F. Block Diagram – Wires • Transfer data between block diagram objects through wires • Wires are different colors, styles, and thicknesses, depending on their data types • A broken wire appears as a dashed black line with a red X in the middle DBL Numeric Integer Numeric String Scalar 1D Array 2D Array
B. LabVIEW Data Types – Terminals Terminals visually communicate information about the data type represented
B. LabVIEW Data Types – Numerics • The numeric data type represents numbers of various types • To change the representation of a numeric, right-click the control, indicator, or constant, and select Representationfrom the shortcut menu
B. LabVIEW Data Types – Boolean • Behavior of Boolean controls is specified by the mechanical action • In LabVIEW, the Boolean data type is represented with the color green
Mechanical Action of Booleans Use the Mechanical Action of Booleans VI located in the NI Example Finder to learn about the different switch and latch actions.
B. Data Types – String • A sequence of displayable or non-displayable ASCII characters • On the front panel, strings appear as tables, text entry boxes, and labels • Change the display type from the short-cut menu: Normal, ‘\’ Codes, Password and Hex • Edit and manipulate strings with the String functions on the block diagram • In LabVIEW, the string data type is represented with the color pink
B. Data Types – Enum An enum represents a pair of values, a string and a numeric, where the enum can be one of a defined list of values
B. Data Types – Enum • Enum: enumerated control, constant, or indicator • Enums are useful because it is easier to manipulate numbers than strings on the block diagram
B. Data Types – Dynamic • Stores the information generated or acquired by an Express VI • Non-Express VIs do not accept the dynamic data type • To use a built-in VI or function to analyze or process the dynamic data type, you must convert the data type • Numeric, waveform, or Boolean data indicators or inputs automatically convert the dynamic data type when wired • In LabVIEW, the dynamic data type is represented with the color dark blue
F. Block Diagram – Wiring Tips • Press <Ctrl>-B to delete all broken wires • Right-click and select Clean Up Wire to reroute the wire
F. Block Diagram – Wiring Tips Use the Clean Up Diagram tool to reroute multiple wires and objects to improve readability • Select a section of your block diagram • Click the Clean Up Diagram button on the block diagram toolbar
I. Dataflow LabVIEW follows a dataflow model for running VIs • A node executes only when data are available at all of its input terminals • A node supplies data to the output terminals only when the node finishes execution
I. Dataflow – Quiz Which node executes first? • Add • Subtract • Random Number • Divide • Sine
I. Dataflow – Quiz Answers NO CORRECT ANSWER Which node executes first? • Add – possibly • Subtract – definitely not • Random Number – possibly • Divide – possibly • Sine – definitely not
Summary—Quiz • Which function executes first: Add or Subtract? • Add • Subtract • Unknown
Summary—Quiz Answer • Which function executes first: Add or Subtract? • Add • Subtract • Unknown
I. Case Structures • Have two or more subdiagrams or cases • Execute and displays only one case at a time • An input value determines which subdiagram to execute • Similar to case statements or if...then...else statements in text-based programming languages
I. Case Structures • Case Selector Label: contains the name of the current case and decrement and increment buttons on each side • Selector Terminal: Wire an input value, or selector, to determine which case executes
Practice • Addto the previouspractice a button in orderto update the stringlabel ONLY if the buttonispressed. Thenrun. • Changeitsmechanicalaction and runagain. • Create a enumcontrolwithitems “Heating”, “Cooling”, “Conditioning” and useitsvaluesto turn on label “too hot” only, label “toocold” only, or both, accordingto the case selected. • Make the stringindicator display “Hithere!” if the userinputs “Hello”, or the same input stringifotherwise.
I. Case Structures – Default Case • You can specify a default case for the Case structure • If you specified cases for 1, 2, and 3, but you get an input of 4, the Case structure executes the default case • Right-click the Case structure border to add, duplicate, remove, or rearrange cases and to select a default case
I. Case Structures – Input & Output Tunnels You can create multiple input and output tunnels • Inputs are available to all cases if needed • You must define each output tunnel for each case
I. Case Structures – Use Default if Unwired Default values are: Avoid using the Use Default If Unwired option on Case structure tunnels • Adds a level of complexity to your code • Complicates debugging your code
I. Case Structures – Boolean Boolean input creates two cases: True and False
I. Case Structures – Integer • Add a case for each integer as necessary • Integers without a defined case use the default case