Download
1 / 18
180 likes | 326 Views
Warm-Up 9/5. Round the following numbers to the nearest tenth 6.258 2) .0634 Round the following numbers to the nearest hundredth 3) .0175 4) 42.0444 . Concept 1: Sampling Analysis. LEQ: 1) What are the characteristics of a representative sample?

E N D
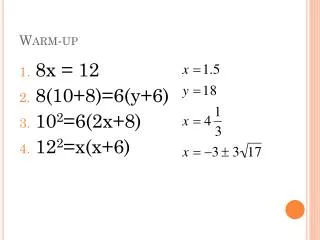
Warm-Up 9/5 • Round the following numbers to the nearest tenth • 6.258 2) .0634 Round the following numbers to the nearest hundredth 3) .0175 4) 42.0444
Concept 1: Sampling Analysis LEQ: 1) What are the characteristics of a representative sample? Vocabulary: Sample, Representative Sample, Population
Think About This: Journal Entry • How could the people who reported these data know about the eating, sports, and television viewing activities of all 260 million Americans?
Data Collection • When you want to get information about a large group or Population, such as the students at your school or all the fish in a lake, it would be very hard to collect data from each and every person/thing in the group. Instead, you can study a small portion of the group, or a sample. Can you think of some times where you have hear the word sample or population before? Write them down in your notes
Vocabulary • Population: A group of people (or objects or events) that you are gathering information about • They can be animals, insects, or even plants • Sample: A number of people, objects, or events chosen from a given population to represent the entire group. It is a smaller portion of your group.
Choosing a Sample • There are a few things to consider when choosing a sample. The first is sample size. You need to make sure that you have enough data to be sure your conclusions are accurate. How much is enough? You decide. It depends on your population. The larger the amount of people/things in the population, the larger the sample size will need to be. In general, the larger the sample size, the more representative it is of the population.
Choosing a sample continued.. • The sample needs to be representative. If it is representative of the entire population, it can be used to make predictions about the entire group. • What makes a sample representative? It needs to closely match the population. In other words, it has to have a similar make up.
Each subgroup in the population should be represented in the sample • ie- if there are boys in your population, there should be boys in your sample • Each subgroup should be represented proportionally • ie- if half of your population is girls, half of your sample should be girls
Example • Population: You want to know what foods most middle school and high school students like • Non-representative sample: • Only asking members of the boys soccer team • Only asking students at your middle school • Representative sample: • Asking a few people from each middle school and high school In order for the sample to be representative, it would need to include boys and girls of middle school and high school age, as well as people from different cultures and neighborhoods
When your sample is not representative, you get…. Sampling Bias! • Sampling bias is caused by errors in the sampling process. This can prejudice your evaluation findings in some way. The information gathered will not give you an accurate prediction or conclusion of your population.
Example Think Pair Share • Mrs. Jones teaches an 8th grade math class in Texas. She wants to find out if 8th graders in Texas prefer cola or juice, so she polls her thirty 8th grade students. She finds out the most of them prefer cola over juice. • population = sample = Is this sample representative? • Is there sampling bias?
Mrs. Jones teaches an 8th grade math class in Texas. She wants to find out if 8th graders in Texas prefer cola or juice, so she polls her thirty 8th grade students. She finds out the most of them prefer cola over juice. • population = all Texas 8th graderssample = Mrs. Jones's thirty 8th gradersIs this sample representative? No • Since it is not representative, it is a biased sample and cannot be used to make predictions • Yes, there was a sampling bias. Since the complete sample was from the same school and class, it does not represent the total population of Texas 8th graders very well. • It would give us an accurate idea about 8th grade students in her school, but not 8th grade students in all of Texas.
Let’s summarize what we have learned! • Make an acrostic poem • S • T • U • D • Y
Ms. Sampson (snaps) • So you want gather information about a population • Take a representative sample • Unless you want your data to be biased • Don’t want that! • You can use the sample to make predictions about the whole group.
Resources Used • Math on Call • Study Island
Practice • Independently complete the worksheet about selecting samples
HW • Representative Sample worksheet