Download
1 / 43
430 likes | 553 Views
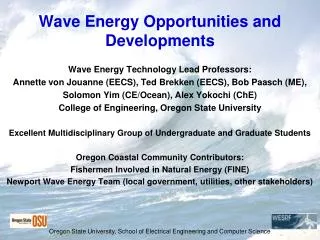
Wave Energy Opportunities and Developments. Wave Energy Lead Professors: Annette von Jouanne (EECS), Ted Brekken (EECS), Bob Paasch (ME), Solomon Yim (CE/Ocean), Alex Yokochi (ChE) College of Engineering, Oregon State University

E N D
Wave Energy Opportunities and Developments Wave Energy Lead Professors: Annette von Jouanne (EECS), Ted Brekken (EECS), Bob Paasch (ME), Solomon Yim (CE/Ocean), Alex Yokochi (ChE) College of Engineering, Oregon State University Excellent Multidisciplinary Group of Undergraduate and Graduate Students Oregon Coastal Community Contributors: Fishermen Involved in Natural Energy (FINE) Newport Wave Energy Team (local government, utilities, other stakeholders)
OSU’s multidisciplinary wave energy team is pursuing Wave Energy innovation in Four thrust areas:1) Researching novel direct-drive wave energy generators (5th prototype was bay and ocean tested Oct. 2007),2) Development of a Wave Energy Demonstration Site-Essential to optimize wave energy topologies -OSU has been proposing a National Dem. Center since 20043) Working closely with the Oregon Department of Energy (ODOE) and a variety of stakeholders to promote Oregon as the optimal location for the nation’s first commercial wave parks.4) Examining the potential biological and ecosystem effects of wave energy systems (HMSC Workshop, Oct. 11th-12th)
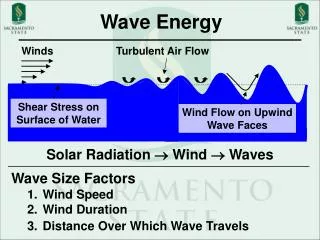
Waves Waves are a concentrated form of solar energy Technology to convert wave energy to electrical energy is in its beginning phase > 1000 Patents < 2 MW Installed Demonstration in the U.S. is the Next Needed Step in the Technology Development Process
New forms of Energy are required ! Introduction to Wave Energy • It is estimated that if 0.2% of the ocean’s untapped energy could be harnessed, it could provide power sufficient for the entire world. Compared to Other Renewables, Wave Energy Advantages: Higher energy density, availability (80 – 90%) and predictability • OSU is an Excellent Location to conduct ocean wave energy extraction research: • Highest Power University-Based Energy Systems Lab • O.H. Hinsdale Wave Research Lab • Hatfield Marine Science Center • Wave energy potentials off the Oregon coast.
Oscillating Water Column (Energetech/Oceanlinx) Wave Energy Extraction Technologies Point Absorber (OPT, Finavera) Overtopping, Wave Dragon Attenuator, Pelamis WP
OSU Strategic Facilities to Advance Wave Energy O.H. Hinsdale Wave Research Lab (HWRL) Wallace Energy Systems & Renewables Facility (WESRF)
OSU - Key Location for Wave Energy Research • 750 KVA Adjustable Power Supply • Variable Voltage input(0-600Vac), 600A • 3-phase adjustable (while loaded) for balanced and unbalanced testing • Highest Power University Lab in the Nation • Enables Multi-Scale energy research • Four Quadrant Dynamometer • Programmable torque/speed • Dynamic Vector Controls 0-4000 rpm • Bidirectional Grid Interface • Regeneration back to the utility grid • Flexible, 300 hp,Motor/Generator test-bed • 120KVA programmable source • Transient VLrms=680V • Steady State VLrms= 530V • Frequency range: 45Hz to 2KHz Wallace Energy Systems & Renewables Facility (WESRF)
OSU Wave Energy Linear Test Bed Creates the relative linear motion between a center “spar” and a surrounding “float” (active components) Enables dynamic testing, using captured wave profiles, while simulating the actual response of ocean waves • Specifications: • 10kW with a 50% efficient device, and up to 19kW @ 95% efficiency • 1m/sec @ 20,000 N Thrust (4500 lbf) • 2m/sec @ 10,000 N Thrust (2250 lbf) • Modes: Velocity, Point-Point, & Force Control (through feedback from load cells/force meters) • 2m relative motion/stroke (6.5 feet) • Upper & Lower Gimbal mounting (for alignment variation) • 14ft tall x 10.5ft wide x 8.5ft deep Design: Mundt and Associates Inc.
OSU – Key Location for Ocean Wave Energy Research • O.H. Hinsdale Wave Research Lab (HWRL) • Dimensions:342ft long,12ft wide, 15ft deep • Wave period range: 0.5 to 10 seconds • Max. Wave: 1.6 m (5.2 ft) @ 3.5 sec
Power from Ocean WavesAvailable Resource off Oregon Coast NDBC Data Buoys CDIP (SCRIPPS) Data Buoys • 50% of the US population lives within 50 miles of the coast • Oregon has some of the richest ocean wave energy potentials in the world
Power from Ocean WavesAvailable Resource off Oregon Coast Data buoys are 2-200mi off shore, with waves traveling 15-20mph, gives 10+ hours forecast time for buoy generators located 2 mi out Seasonal variation – Good match for the NW load demand (wave data From National Data Buoy Center, Power estimated from 5 buoys off the Oregon coast over past 10 years) Power from a wave is W/m of crest length (distance along an individual crest) = the density of sea water = 1025 kg/m3 g = acceleration due to gravity = 9.8 m/s2 T = period of wave (s) (averages 8s in the winter to 6s in the summer) H = wave height (m) (averages 3.5m in the winter to 1.5m in the summer)
Power From Ocean Waves kW/m crest length
Wave energy is strongest on the west coasts and increases toward the poles. • At approx. 30 kW/mcl in the Northwest (yearly avg.), a single meter (3.3 feet) of wave has the raw energy to power about 23 homes. Power From Ocean Waves [George Hagerman]
Potential Wave Energy Impact on Oregon (Load Data Provided by PGE) Oregon 2005 Avg Consumption Generation West of Cascades: 3,488MW (68%) 2,487MW (29%) (1001MW deficit) East of Cascades: 1,633MW (32%) 6,163MW (71%) Total: 5,121MW 8,650MW From the previous slide (Winter avg is 50kW/m, Summer avg is 10kW/m), Considering an overall average of 30kW/m and an Oregon coastline of 460km, the total Oregon coast “raw” Wave Energy potential is in the range of 13,800MW In Perspective Seven sites have been identified by EPRI study, with the potential to expand to 100MW (estimated that three sites could be fully licensed in next 7-10 years) Oregon goal for 25% renewables by 2025 (this goal could be 50% satisfied by 700MW from wave energy, based on current consumption)
EPRI Study: Seven Oregon Sites • Astoria • Garibaldi INSERT OREGON MAP ‘Wave Park’ Sites Identified by EPRI Study • Newport • Cushman • Reedsport • Coos Bay • Brookings
Wave Energy preliminary permits filed with FERC as of Fall 2007
OSU Test Berth Site agreed upon with FINE Finavera Buoy Watch Circle TriAxys Buoy Watch Circle OSU Buoy Watch Circle 0 3000’ 6000’
Direct-Drive Buoys (Current Technology Focus) Focus on simplification of processes, i.e. replacing systems employing intermediate hydraulics or pneumatics with direct-drive approaches to allow generators to respond directly to the movement of the ocean. The term "direct" drive describes the direct coupling of the buoy's velocity and force to the generator without the use of hydraulic fluid or air. The direct drive approach could either employ magnetic fields for contact-less mechanical energy transmission (flux-linkage), or use a form of mechanical linkage. OSU’s Devices and Goals Devices Must beSurvivable, Reliable, and Maintainablewith efficient and high quality power take-off systems
History of OSU’s Novel Direct Drive Buoy Approaches (First three prototypes) Permanent Magnet Linear Generator Contactless Force Transmission (eliminates “working seals”) Permanent Magnet Rack and Pinion Drive (Licensing through Columbia Power Technologies)
The Pacific Storm was able to hold station in order to allow the power take-off cable to go directly to the power analysis and data acquisition system on the vessel
National Wave Energy Center Federal Appropriations Proposal Establish a National Wave Energy Center (NWEC) to: • Demonstrate and compare existing technologies • Research and develop advanced systems • Investigate efficient and reliable utility integration/intermittency issues • Advance wave forecasting technologies • Conduct experimental and numerical modeling for device and wave park array optimization • Evaluate potential environmental and ecosystem impacts • Establish protocols for outreach/engagement and how the ocean community best interacts with wave energy devices and parks • Refine wave energy power measurement standards • Improve wave energy device identification/navigation standards • Offer wave energy educational workshops • Enable enhanced testing of instruments, etc.
Oregon Wave Energy Investments The Oregon Legislature is providing $4.2 million in state funds to start the Oregon Wave Energy Trust (OWET), and to support and accelerate responsible development of Oregon’s wave energy industry (2007-2009 Biennial Budget). Environmental Assessment and Planning: $2M Research & Development: $1M Market Development: $600k Operations: $600k
Oregon Wave Energy Investments The 2007 Legislature appropriated $3M in capital funds toward the establishment of the Wave Energy Demonstration Center. These funds will be used to design and build a first stage demonstration test berth and associated infrastructure off Newport, Oregon. Vision for a fully funded National Demonstration Center: • 5 test berths ~ 2 miles offshore • total capital cost ~ $8 million • operating costs of ~ $1 million per year
Research Includes Advanced Modeling Techniques Fluid to Moving Structure Interaction(coupled fluid-structure interaction) Buoys heaving in waves, using Finite Volume Computational Fluid Dynamics Solver (COMET) (Finite Element/Volume Mesh Analysis)
Wave Energy Park Environmental Monitoring Effects of Electromagnetic Fields: Sea bird attraction? Marine Mammal attraction, repulsion. Changes in whale migration pathways. Change in larval dispersion. Change in fish use of area, change in fish migration, change in fish reproductive success. Shark attraction. Effects from construction/deployment/service of cables The most destructive aspect of laying natural gas lines is during the deployment of lines; the seafloor with its inhabitants are altered as the line is laid with large machinery. Similar effects could be expected with lying of electric cables if similar methods are used. Impact on invertebrates or seafloor structure from placement of anchors and power lines. Creation of a sediment plume and resulting impacts on fish/invertebrates. Effects of the physical structure of the buoy field. Entanglement of marine mammals: whales, dolphins. Effects of using antifouling agents: introduction of toxics. Creation of a new community: Does the new structure act as a filter for larval dispersal so that recruitment in surrounding areas is decreased? Will the structure create a new habitat that will facilitate recruit and production of marine organisms? Monitoring needs to be scale appropriate. Impacts from small scale may not be scaleable to large energy generation farms. Monitoring program needs to be adaptive in design to respond to evolving impacts Monitoring needs to compare manipulated and un-manipulated areas.
Oregon Wave Energy Industry Collaboration Wave Energy OPAC (Ocean Policy Adv. Council) BPA, Navy NREL (USDOE) OR Econ. & Comm. Dev. Industry PNGC NOAA Governors Office Hatfield Marine Sci. Ctr. Developer PacifiCorp USACE Legal State Legislators OR DLCD Fabricators CLPUD Coast Guard Com’l Fishing & Crabbing OR State Lands Operations Maintenance PGE FERC, MMS Recreation / Marine Concerns OR State Marine Board Quality Control
Oregon’s Leadership Opportunity • Unique ocean resource • Established marine community • Excellent reputation for renewable energy and green industry support • Positive political climate (both state & federal) “Oregon is poised to lead the nation and the world in wave energy research, development and production. We have the wave resource, the expertise through collaboration including tremendous university, industry, utility and community support, and the utility infrastructure along the coast to deliver this clean, renewable power into the grid.” For More info on Wave Energy: DVD from Oregon Sea Grant