Download
1 / 21
210 likes | 336 Views
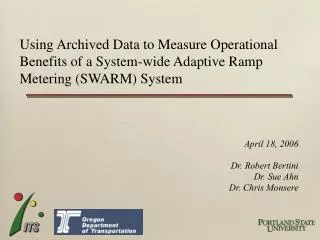
Using Archived Data to Measure Operational Benefits of a System-wide Adaptive Ramp Metering (SWARM) System Task 4: Pilot Study. July 31, 2006 Robert Bertini Sue Ahn. Presentation Outline. Work Plan – Progress Pilot Study Data Collected Data Analysis Results Remaining Task – TAC input

E N D
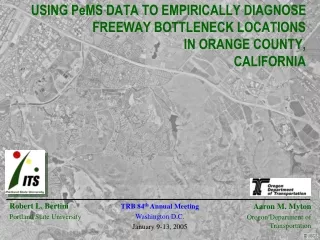
Using Archived Data to Measure Operational Benefits of a System-wide Adaptive Ramp Metering (SWARM) SystemTask 4: Pilot Study July 31, 2006 Robert Bertini Sue Ahn
Presentation Outline • Work Plan – Progress • Pilot Study • Data Collected • Data Analysis • Results • Remaining Task – TAC input • Recommendations for the Regional Study
Work Plan - Progress • Task 1: Literature Review • Report under revision • Task 2: Corridor Selection • Report under review • Task 3: Data Collection Plan • Report under review • Task 4: Pilot Study • Freeway performance • On-ramp performance - ongoing
Pilot Study: Data Collection • Pre-timed: June 19 – 23, 2006 • SWARM: June 26 – 30, 2006 • Accidents: June 21 and June 30 (excluded from analysis) • Weather: Comparable (high temperature on the 2nd week)
Pilot Study: Data Analysis • Data Quality: Communication Failures • Freeway: VMT, VHT, Travel Time, Delay • On-ramps: Queue spill-over • Frequency • Durations • Total delay: on-going Challenge
What happened?? • SWARM is not operating optimally • Parameters need to be fine-tuned • Effect of communication failures • Smaller discharge rate from the bottleneck • Larger freeway delay but smaller system-wide delay • Larger inflow from the on-ramps • Short pilot study duration: The results are not statistically significant.
Delay (Pre-timed) Difference in delay (vehicle-hours) Travel Direction
Delay (SWARM) Difference in delay (vehicle-hours) Travel Direction
Change in Delay (SWARM – Pre-timed) Difference in delay (vehicle-hours) Travel Direction
Change in Delay Delay (veh-hrs)
On-ramp Volumes: Morning Peak Hours (6:30-8:30AM)
Pilot Study: Queue Spill-over Scholls-Ferry Rd. Beaverton-Hillsdale Highway
Next Steps • Reasons for the increase in delay • More analysis on on-ramps • Total delay? – require counts at meters • Travel time (sampling frequency) • Report
Recommendations • Data near bottleneck to measure bottleneck discharge flow • Agree on performance measure for on-ramps • Total delay, queue length, queue spill-over • All or selected on-ramps • Data collection method for on-ramps • Video: time-consuming for total delay