Download
1 / 50
500 likes | 579 Views
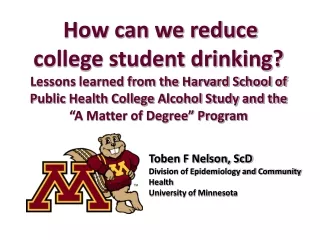
How a Culture of Inquiry Can Help Your College Move the Needle on Student Success. Dr. Rob Johnstone Texas Pathways to Progress Institute Dallas, TX September 22, 2014. Acknowledgements.

E N D
How a Culture of Inquiry Can Help Your CollegeMove the Needle on Student Success Dr. Rob Johnstone Texas Pathways to Progress Institute Dallas, TX September 22, 2014
Acknowledgements • Much of the content in this presentation in conjunction with national projects such as Completion by Design, the Aspen Prize for CC Excellence, and Bridging Research, Information & Cultures (BRIC) • Content has also been developed by and with a host of national partners, including: • Community College Research Center (CCRC) • Jobs for the Future • JBL Associates • Public Agenda • The Research & Planning (RP) Group • Infographics were primarily designed by Greg Stoup
Formalistic Doublespeak… • Give your 1st reaction to the following list of words: • Accountability • Accreditation • Assessment • Continuous Improvement • Data-Driven Decision Making • Evaluation • Institutional Effectiveness • Key Performance Indicators (KPIs) • Learning Outcomes Assessment • Performance-based Funding • Program Review • Strategic planning
Recapturing the Movement… • Vivid imagery from previous slide • Faculty, Student Services folks & leaders have been beaten over the head with these phrases • they are correct to analyze that they too often haven’t led to authentic improvement • and the more formal the process, often… • There is good news for our improvement efforts – you can do all of the things captured by those words in more authentic and less formalistic ways
Changing the Conversations… • We have to make the conversation about things faculty, staff & administrators care about – students, their learning, and improving their outcomes and lives • Not everybody will come along – but we don’t need everybody • Org Change Thought: Red light / Yellow light / Green light • People need to see their expertise acknowledged and integrated – and the effect of their efforts on outcomes
April 2014 A Culture of Inquiry & Action A RESOURCE for INSTITUTIONAL change
An Applied Inquiry Framework for Student Completion (CBD) • Stage 1 – Explore how to improve outcomes • Stage 2 – Gather meaningful evidence • Stage 3 – Discuss evidence broadly • Stage 4 – Use evidence to inform change • Stage 5 – Measure the impact of change
What is a Culture of Inquiry? Institutional capacity for supporting open, honest and collaborative dialogfocused on strengtheningthe institution and the outcomesof its students.
Culture of Inquiry: Features • Widespread access to user-friendly information on student outcomes • Encouraging more people to ask a wider collection of questions and use their evidence and conclusions to enhance decision making • Reflective and dynamic discussions across constituency groups
Culture of Inquiry: More Features • Continuous feedback so adjustments can be made along the way and processes can be adapted • A sense of ownership over improving student outcomes – not blaming the student • Using insight generated from inquiry to act at varying levels of the institution to create the conditions to improve outcomes
STAGE 1 Explore how to improve student outcomes Focus inquiry on designing approaches that improve student outcomes
How We Spend Our Time Matters… • When was the last time you sat in a standing committee meeting on your campus that used evidence to explore a key student progress, completion, labor market, learning or equity outcome for more than 20 minutes? • What types of questions do we spend most of our organizational resources answering?
Malcolm Gladwell talks about the right question… • Link to full video: http://www.ted.com/talks/malcolm_gladwell_on_spaghetti_sauce
The Right Question in the CC World… Placement Tests & Cut Scores • What was the problem we were trying to solve? • I’d posit it was something like: • “Can we find a short instrument that will help us assign incoming students to various levels of math & English?” Or… • “How do we ensure higher levels of course success in transfer-level math & English courses? • Are these the best questions? Why or why not? • Note: current system of placement tests may not even be the best solution for this question: LBCC / CCRC
What if we tried to solve… • What placement process is the most predictive of transfer-level course success? Or…. • What is the optimal curricular structure to ensure that the greatest number of students pass transfer-level math / English courses with appropriate rigor? Or….
More questions… • What is the optimal math curriculum that produces computational learning outcomes that most students will need in the real world? Or… • Is writing about literature the optimal way to teach students the writing skills they need in their general education courses? What about in the real world?
Organizing Question of Improvement Science: What problem are you trying to solve?
An Example from AB Tech in Asheville, NC… • We have to make sure our improvement efforts to trying to solve the right problem • “Right” is slippery – the problem at hand may be important, but it might detract us from a larger problem that is of much higher impact to improving student outcomes • AB Tech’s “One Stop” Onboarding process • Original problem they were trying to solve: “How do we address the chaotic and disconnected nature of the onboarding of our new students?
One Stop Address the Chaotic Onboarding Problem, but… • As the AB Tech folks reflected on their efforts, they realized they might unintentionally communicate to students that it’s possible in four hours or one day to: • assess interests • match interests to careers • pick a program • register for classes • figure out financial stability issues • be ready for opening day • be prepared for any bump in the road that might occur
Perhaps… • A better question / problem to solve might be: “How do we ensure that students get the services they need – when they need them – as they move through their educational trajectory at our college?” • Note that this still covers having a more streamlined onboarding experience – but recognizes that it sits in a larger context to be addressed
To sum up the starting line stage… • More focus on asking the right question, and ensuring we know what problem we are trying to solve – actually less focus on the data per se • Sometimes exploring the data can help you realize you’ve been asking the wrong question - The Right Pepsi vs. The Right Pepsi’s • Traditional questions: enrollment, course success, material covered • Emerging questions: improving outcomes - completion, progress, learning, labor market, equity
STAGE 2 Gather meaningful evidence Collect high-quality, meaningful evidence at the student support, classroom, program, and institutional levels
When gathering evidence, make sure you are focusing on the right data…
20 year trend for California CCcourse success & persistence rates Persistence Rate Success Rate What does that tell us about the usefulness of these metrics in setting institutional strategies? 1989 2008
The Aspen Prize’s Take on Data & Outcomes that Matter • Progress / Completion Outcomes • Labor Market Outcomes • Learning Outcomes • Equity in Achieving First Three Outcomes • Examples of each in Appendix presentation…
Gather meaningful evidence for the “Four Big Ideas for Redesign” • Structured Pathways / Programs of Study • Better On-ramps into POS • Accelerated / co-curricular Dev Ed, First Year Experience • Intentional Student Support Structures • Intake system, onboarding, advising • Monitoring Progress / Customized Feedback
Progress Example 1: Grades in Sequenced Courses
Grades in Sequenced Courses Backdrop • Course sequences analyzed in Mathematics, English, Biology, Chemistry, Physics & Economics • Relationship between grade in 1st course in sequence and success in 2nd course in sequence was examined. • Enrollment data tracked over five-year period • Selected highlight slides follow; full PPT provided on request
And Not Often Enough Like This… Pre-Algebra Introductory Algebra Intermediate Algebra Intermediate Algebra Transfer-Level Math 306 Math 308 Math 310 Math 310 Math 1300s The grade received by students in Math 308 Success Rate of those same students in Math 310 100% 90% A A 81% 80% 70% Those placing directly into Math 310 60% 60% 57% B B 50% 40% 37% 30% C 20% 10% 0%
Calculus Course Sequence Calculus I Calculus II Calculus II MATH 2413 MATH 2414 MATH 2414 The grade received by students in Math 2413 Success Rate of those same students in Math 2414 100% 90% 90% A A 78% 80% Those placing directly into Math 2414 72% 70% 60% 50% B B 50% 40% 30% C 20% 10% 0%
Developmental Education Writing Course Sequence Two Levels below Transfer One Level below Transfer Transfer Level English One Level below Transfer ENGL 306 ENGL 307 ENGL 1301 The grade received by students in English 307 Success Rate of those same students in English 1301 100% 90% A A 80% 74% Those placing directly into English 1301 71% 70% 61% 60% B B 46% 50% 40% 30% C 20% 10% 0%
College Biology Course Sequence Anatomy Physiology Physiology BIO 2401 BIO 2402 BIO 2402 The grade received by students in Biology 2401 Success Rate of those same students in Biology 2402 100% 88% 90% A A 80% 72% Those placing directly into Biology 2402 70% 67% 60% 50% B B 50% 40% 30% C 20% 10% 0%
College Chemistry Course Sequence General Chemistry I General Chemistry II General Chemistry II CHEM 1411 CHEM 1412 CHEM 1412 The grade received by students in Chemistry 1411 Success Rate of those same students in Chemistry 1412 100% 86% 90% A A 80% 70% Those placing directly into Chemistry 1412 70% 66% 60% B B 46% 50% 40% 30% C 20% 10% 0%
Economics Course Sequence Macro Economics Micro Economics Micro Economics ECON 2301 ECON 2302 ECON 2302 The grade received by students in Economics 2301 Success Rate of those same students in Economics 2302 100% 89% 90% A A 81% 80% 74% Those placing directly into Economics 2302 71% 70% 60% B B 50% 40% 30% C 20% 10% 0%
STAGE 3 Discuss evidence broadly Engage a variety of campus stakeholders in evidence-based discussions about improvements in practice
Key Concept: Data do not speak for themselves Time & Space Needed to Explore Data, Make Meaning & Generate Insight
Exploring Data Example: English & Math Preparedness & Success in GE Courses
Success in Psychology 101 for students simultaneously enrolled in an English course English 826 (Two Below) English 836 (One Below) English 100 (Transfer A) English 110 (Transfer B) Success Rate of those same students in Psychology 101 English course taking profile for students in Psychology 101 100% 90% 75% 80% Not in an English course 68% 70% 64% 60% 48% 50% 40% 31% 33% 67% 30% 20% 10% 0% Note: Enrollments from Summer 2000 to Spring 2009; Success is defined as A/B/C/CR grade
Success in Psychology 101 for students simultaneously enrolled in an Math course Fundamentals Beginning Algebra Intermediate Algebra Transfer Level Math Math course taking profile for students in Psychology 101 Success Rate of those same students in Psychology 101 100% 90% Not in an Math course 76% 80% 70% 64% 63% 60% 51% 50% 43% 40% 37% 63% 30% 20% 10% 0% Note: Enrollments from Summer 2000 to Spring 2009; Success is defined as A/B/C/CR grade
Success in five highly enrolled GE courses by English enrollment level English 826 (Two Below) English 836 (One Below) English 100 (Transfer A) English 110 (Transfer B) Speech 101 Psychology 101 Economics 101 History 101 HSCI 101 100% 90% 88% 82% 82% 80% 79% 75% 74% 73% 73% 70% 68% 64% 60% 60% 57% 56% 54% 51% 48% 50% 48% 43% 40% 31% 27% 30% 20% 10% 0% Note: Enrollments from Summer 2000 to Spring 2009; Success is defined as A/B/C/CR grade
Success in five highly enrolled GE courses by English enrollment level English 826 (Two Below) English 836 (One Below) English 100 (Transfer A) English 110 (Transfer B) Accounting 101 Fitness 334 Music 202 Biology 250 Sociology 101 100% 90% 80% 80% 76% 74% 74% 73% 70% 68% 66% 65% 64% 60% 60% 59% 58% 50% 50% 50% 48% 40% 40% 37% 40% 31% 30% 20% 10% 0% N/A Note: Enrollments from Summer 2000 to Spring 2009; Success is defined as A/B/C/CR grade
STAGE 4 Use evidence to inform change Implement changes in practice and policy based on analyses and discussion of college evidence
Use evidence to guide innovation • In this context, research and applied inquiry are fundamentally interventionist in nature. • We are not seeking absolute truths; rather we are looking for patterns of evidence that inform action-oriented decisions. • Failure can be seen as an opportunity for learning, especially when outcomes are shared and used to inform further improvements in practice.
And what do we do when the evidence is ambiguous? What to do when you reach the limits of your research and yet still face multiple choices? Domain of possible solutions The process of inquiry is not a search for an absolute truth Trust your expertise & choose ! We answer the questions that eliminate dead end solutions Gregory M Stoup, Cañada College
STAGE 5 Measure the impact of change Evaluate the impact of practice changes on student outcomes
Final Reflections • Creating or evolving your culture of inquiry isn’t magic; there are clear steps and resulting artefacts of such a culture • Don’t focus too much on the data – the questions you ask are exponentially more important • Remind yourself and your team to constantly ask: “What problem are we trying to solve?”
What we are shooting for… • Great statement of the desired end state from a CC President at the Aspen / ATD Leadership Symposium: “A wider range of people on a campus ask a better set of questions about outcomes & act on their reflections to improve them.”
Find Out More • The National Center for Inquiry & Improvement website www.inquiry2improvement.com • Dr. Rob Johnstone, Founder & President rob@inquiry2improvement.com • CBD Inquiry Guides on Applied Inquiry & Nuances of Completion: http://www.inquiry2improvement.com/publications-resources