Download
1 / 38
380 likes | 384 Views
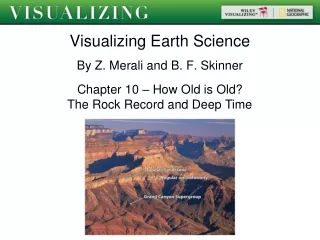
Visualizing Complexity in Science Classroom Learning Environments. Carol Stuessy, Texas A&M University. Purpose of the Study.

E N D
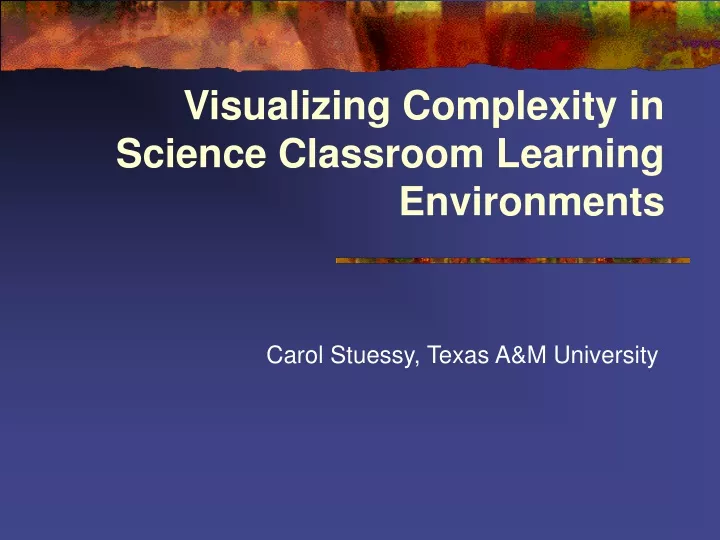
Visualizing Complexity in Science Classroom Learning Environments Carol Stuessy, Texas A&M University
Purpose of the Study To develop an observation instrument that characterizes interactive learning environments in terms of their complexity, interactions, and levels of information received and constructed by learners.
What are our purposes today? • To briefly review the Multiple Representations Model, which provides the foundation for the development of the Science Classroom Observation Profile (SCOPS) • To review the features of the SCOPS • To display and compare examples of SCOPS profiles in a research setting and a mentoring setting
The Multiple Representations Model • Identifies external representations used by both scientists and learners to “make sense” of natural phenomena • Shows relationships between and among external representations as they can be used to produce external models of these phenomena • Shows interactions between external representations and the cognitive construction of internal representations (i.e., mental models)
For Use in Preservice Science Teacher Preparation • To assist preservice teachers in understanding the relationship between External Representations Hands-on, Pictures, Symbols Internal Representations Generalizations, Mental Models
Distinguishing Features of the SCOPS • Minute-by-minute classroom observation records • Synthesis of data in visual, two-dimensional profiles • Visual profiles operationalize new lexicon of complex patterns (i.e., flow, complexity, representations)
Feature I – Minute-by-Minute Observation • As the activity of the learners changes, the segment changes • Each lesson therefore has a number of segments • Each segment of instruction is characterized by • Length in minutes • Scripts • Codes
Segments and Scripts • Beginning and end of each segment are timed • Time of each segment is converted to a % of entire lesson • Number of segments vary lesson to lesson • Scripts explain what the teacher does • Scripts explain what the students receive • Scripts explain what the students do
Seg St-Centr What the Student Receives How the Student Responds R&D P&I Receiving Obj Sym Pict Responding Obj Sym Pic 1 (10 min.) 5 1 Instructions on task from the teacher: to sequence number cards consisting of words, decimals, and fractions; teacher holds up cards, which have numbers and words on them; demonstrates how cards would be placed in order on a number line 1 4 Students listen to teachers’ instructions and view the types of number cards as the teach holds them up; they observe the teacher place the sequence of cards on the number line in ascending order 1 1 2 (20 min.) 3 3 Pairs of students acquire cards and discuss arrangements with each other 1 5 Pairs of students arrange cards in order from smallest to largest 4 4 Sample Script of Two Segments
Coding • Instructional strategies • Representations of what students receive and what students do during the segment • Symbolic (letters and/or numbers) • Pictorial (graphs, pictures, charts) • Objects (3-dimensional manipulatives)
1 R&D = Reception and Direction P&I2 R&D1 Description of Strategy Example 5 1 Individual students listen as the teacher or another student talks to entire group; students read Direct instruction models; silent reading 4 2 Individual students respond orally or in writing to questions asked by the teacher, in whole group Question and answer; discussion led by teacher 3 3 Students in pairs or in small groups work together under the teacher’s supervision – with discussion; all groups do basically the same task Students complete tasks as outlined by teacher; cookbook/verification labs; cooperative learning models 2 4 Groups of students and/or individual students work on different tasks, loosely supervised by the teacher, with the teacher supporting separate groups’ completion of tasks Groups of students complete different tasks with assistance by teacher as needed 1 5 Students in pairs or small groups discuss and formulate plans, work with little teacher supervision Open-ended lab or project work 0 6 Individual students formulate plans and carry out plans independently (with minimal teacher input) Individualized laboratory, computer or seat work 2 P&I = Performance and Initiative
Level Actions of Students in Receiving and/or Performing with Symbols, Pictures, and Manipulatives Replicate 1 Listen to, attend to, observe, manipulate, count, record, recall, measure, reproduce, show, demonstrate, show 2 Identify, give examples, explain, describe, clarify, interpret, calculate, collect information, document, duplicate a pattern Rearrange/Transform 3 Organize, compare, group, sort, sequence, balance, classify, take things apart, recognize patterns 4 Choose, decide, differentiate, distinguish, put parts together to make a whole, arrange into patterns Generate/Create 5 Connect, relate, infer, predict, plan, hypothesize, make analogies 6 Analyze, evaluate, summarize, conclude, construct from scratch, design, model
Feature II – Visual Profiles • Progression of the lesson from beginning to end • Length of each segment and characterization • Characterizations • Instructional strategy • Types of representations received • Types of representations constructed
Features of SCOP data used to characterize science lessons • FLOW • REPRESENTATION PATTERNS • Symbolic • Pictorial • Manipulative (Hands-On) • STUDENT CENTEREDNESS • BALANCE • COMPLEXITY
Feature III – Profile Interpretation • Flow • Balance • Complexity • Representations • Overall Lesson Coherence
Methods • Pilot study • Two secondary science classrooms were observed and videotaped • Videotapes were analyzed using the SCOPS • SCOPS were used to compare and contrast the two similar San Antonio classrooms
Comparison of Two Teachers by Traditional Instrument Teacher A-9 B-9 Student A-9 B-9 • Writing 20 5 • Listening/Watching 45 35 • Discussion 0 18 • Manipulating 15 12 • Off Task 20 30 • Percentages of Time • Bold represents > 15% Explanation 40* 30 Discussion 20 0 Demonstration 30 10 Management 30 20 Discipline 0 10 With Small Group 40 30 With Large Group 50 60 Alone 10 10
Legend Receiving or performing using Pictures Student-Centeredness Receiving or performing using Manipulatives Receiving or performing using Symbols Figure 3. Profiles of urban classrooms constructed for a pilot study of urban middle school science teachers. See Stuessy, Foster, & Knight (2002).
SCOPS Classroom Profiles Classroom A-9 Classroom B-9
Flow from more teacher-directed to student-directed activities About 1/3 Teacher Directed, 1/3 Shared, 1/3 Student Directed Balance about = Flow from more teacher-directed to shared back to teacher-directed About 2/ 5 Teacher Directed, 2/ 5 Shared, 1/5 Teacher Directed Balance unequal, Teacher > Shared and 0 Student Directed Flow and Balance A-9 B-9
A-9 Maximums Receiving – 10 (20%) Responding – 16 (35%) Minimums Receiving – 2 (35%) Responding –2 (10%) B-9 Maximums Receiving – 8 (8%) Responding – 7 (38%) Minimums Receiving – 4 (20%) Responding – 2 (25%) Complexity Ranges and % Time 26 15
A-9 Receiving Symbolic – 100% (1-3) Objects - 25% (2-3) A-9 Responding Symbolic – 100% (1-5) Objects – 25% (1-6) B-9 Receiving Symbolic – 100% (1-2) Objects – 8% (2) Pictures – 50% (1-2) B-9 Responding Symbolic – 100% (1-2) Objects – 8% (1) Pictures – 50% (1-2) Representations and Ranges
Coherence Flow Balance Complexity Representations A-9 shows more range in student-centeredness and flow from teacher to student A-9 was equally balanced in student-centeredness; B-9 was not A-9 had greater maximums with greater time spend in receiving higher levels of instruction A-9 used two representations; B-9 used 3
Uses • Research tool • Preservice teacher preparation • Inservice teacher preparation and/or enhancement
Legend Receiving or performing using Pictures Student-Centeredness Receiving or performing using Manipulatives Receiving or performing using Symbols Figure 3. Profiles of urban classrooms constructed for a pilot study of urban middle school science teachers. See Stuessy, Foster, & Knight (2002).
Fish Sequence Example • Alternative certification candidate • Degreed in biology • On-the-job training • Three lessons mediated by university faculty mentor • SCOPS used in observing classroom and follow-up mentoring
Houston – Example B San Antonio –Example A
100 80 60 40 20 0 TIME SEGMENT (%) 16 12 8 4 0 4 8 12 16 Receiving/Direction Performing/Initiating COMPLEXITY Profile 4A, Sea Turtles
100 80 60 40 20 0 TIME SEGMENT (%) 16 12 8 4 0 4 8 12 16 Receiving/Direction Performing/Initiating COMPLEXITY Profile 4B, Bony Fish
100 80 60 40 20 0 TIME SEGMENT (%) 16 12 8 4 0 4 8 12 16 Receiving/Direction Performing/Initiating COMPLEXITY Profile 4C, Shark Brain Dissection
The SCOPS has revealed • Change as a result of mentoring • Effective use as a mentoring tool • Effective, informative use as a research tool
Current Research Explores • Differences in patterns in effective and ineffective lessons • Flow patterns in effective lessons which appear to be opposite those of ineffective lessons • Use of multiple representations in more effective lessons • Differences in closure and complexity
What we are learning about the SCOPS • Can be used to compare classrooms on measures of importance in science • Communicates by visualizing classroom coherence • Visually represents abstract concepts, such as complexity, flow, representations • Communicates the interactivity of lesson design • Provides a rich vocabulary and specific lexicon
We also learned that . . . In research settings • Pattern differences can be seen in classrooms where numerical data alone shows little differences