Download
1 / 23
230 likes | 317 Views
WSR-88D Signatures Associated with One Inch Hail in the Southern Plains. Dennis E. Cavanaugh Jessica A. Schultz National Weather Service Weather Forecast Office Fort Worth, TX. Motivation. January 2010: NWS changed Severe Thunderstorm Warning

E N D
WSR-88D Signatures Associated with One Inch Hail in the Southern Plains Dennis E. Cavanaugh Jessica A. Schultz National Weather Service Weather Forecast Office Fort Worth, TX
Motivation January 2010: NWS changed Severe Thunderstorm Warning hail criterion from ¾ inch to 1.00 inch (quarter size) To provide operational forecasters in the Southern Plains with guidance for identifying the presence of 1.00 inch hail or larger in thunderstorms. These methods are not intended to be a replacement for storm interrogation techniques diagnosing thunderstorm structure and damaging wind potential.
Related Research Donavon, R.A. and K.A. Jungbluth, 2007: Evaluation of a Technique for Radar Identification of Large Hail across the Upper Midwest and Central Plains of the United States. Wea. Forecasting, 22, 244-254. Research investigated thunderstorms producing severe hail (¾ inch or greater) in the central/northern Plains during 2001-04 convective seasons Strong linear relationship between 50 dBZ echo height and the height of the melting level As height of melting level increased, so did the expected 50 dBZ height
Related Research Boustead, J.M., 2008: Using Maximum Storm-Top Divergence and the Vertical Freezing Level to Forecast Hail Size. Preprints, 24th Conf. on Severe Local Storms, Savannah, GA. Research investigated thunderstorms in the northern Plains from 2003-2007 The study indicated that storm top divergence is a good indicator of updraft strength and is positively correlated with storms that produce severe hail.
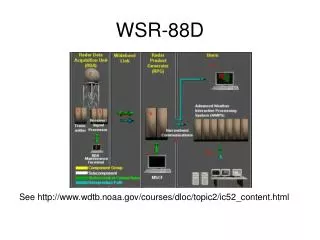
Data • We evaluated techniques in use at Central Region offices that have been issuing severe thunderstorm warnings for 1.00” hail for a few years. • We also evaluated methods that are variants to the techniques used in CR Weather Forecast Offices. • Only techniques that utilize base data products from the WSR-88D were considered, as one of the goals is to identify storms producing large hail before volumetric products are complete. • For now, only official 1.00” hail reports from 2008 were collected. The primary reason we did not look in previous years was to establish a dataset utilizing WSR-88D “super-res” data. We plan to evaluate 2009 after all data are certified.
Data The techniques evaluated are as follows: -height of the highest 50 dBZ echo compared to the melting level* -height of the highest 60 dBZ echo compared to the melting level -dBZ at the -20°C height* -dBZ at the -30°C height* -Column Max reflectivity -Storm Top Divergence* * (techniques at use at various CR WFOs)
Data ~470 1.00 inch hail reports (LSRs) from NCDC within a domain of the Southern Plains Hail reports matched with WSR-88D data retrieved from NCDC, displayed on GR Analyst. A storm had to be within 5 miles of the 1.00” hail report and had to occur within 15 minutes of reporting time. Based on this criteria, around 330 different thunderstorms were identified. Melting Level, -20C level and -30C level data were acquired from environmental data within the North American Regional Reanalysis (NARR) data set using NSHARP.
Difficulties in Collecting Data • When looking at archived radar data, finding the reflectivity at any height is difficult due to mid to upper level sampling issues. • VCP-11 offers a better mid level sampling for determining reflectivity heights, but VCP-12 is often used for better low level sampling for low level wind or TOR detection. • What to do when you have 55+ dbz at one level, but <50 dbz at the next available radar slice (linear interpolation). • In several instances, storm report times were not in line with a thunderstorm over the location. • Spotters may over or underestimate hail. Spotters may also not intercept the largest hail in a given storm.
Data Domain LSRs from an area defined by coordinates: 30.4458, -95.5932 30.4458, -103.0300 36.9537, -95.5932 36.9537, -103.0300 LSRs from 6 WFOs: -Norman, OK (OUN) -Amarillo, TX (AMA) -Lubbock, TX (LUB) -Midland, TX (MAF) -San Angelo, TX (SJT) -Fort Worth, TX (FWD) X X X X X X
Methods • For the 50 and 60 dBZ compared to melting height studies: • Followed an approach similar to the 2007 Donavon & Jungbluth study • Plotted 50 & 60 dBZ height as a function of the height of the melting level AGL. • Performed a linear regression of the dataset • Calculated a confidence interval from the linear regression equation that would capture approximately 75% of the hail reports within the study. • Used the regression equation and the confidence interval to create a table that will potentially serve as warning criterion .
Methods • For the remaining radar identification techniques: • Based on the height of the -20 C and -30 C levels recorded the maximum dBZ at the specified level in the storm associated with the LSR. • For the maximum dBZ contained within the storm, scanned through all tilts of the storm and recorded the maximum dBZ. • For calculation of STD, calculated the maximum radial divergence associated with the top 2-3 slices of the storm (depending on sampling). • Constructed box and whisker plots of data to visualize distribution and potentially provide guidance for warning criterion. • For all data, linerally interpolated between elevation angles where sampling created data collection problems. (Utilized multiple radars when possible.)
Results - 50 dBZHeight • Linear regression yielded the equation: • y = 2.4848 x + 7092.9 where ‘y’ is 50 dBZ height in ft. AGL and • ‘x’ is the melting level in ft. AGL • r = 0.7 indicates a moderate positive linear correlation • A confidence interval with τ=.75 accounted for 75.4% of the data points • y = 2.478 x + 4261.9 associated with the confidence interval • The slope of the line is similar to the 2007 Donavon and Jungbluth study. • The warning criterion threshold is generally higher than the 2007 study. • (A handout with tables is available after the talk.)
Results - 60 dBZ Height • Linear regression yielded the equation: • y = 2.2679 x + 1420.7 where ‘y’ is 50 dBZ height in ft. AGL and • ‘x’ is the melting level in ft. AGL • r = 0.6 indicates a moderate positive linear correlation • A confidence interval with τ=.75 accounted for 74.9% of the data points • y = 2.259 x – 1852.5 associated with the confidence interval • This is simply a variant of the 50 dBZ Height study. • While there is a positive linear correlation, this technique must be tested operationally to determine if it has any skill at identifying thunderstorms capable of producing 1.00” hail. • (A handout with tables is available after the talk.)
-20C, -30C and Column Max dBZ • The average -20 C dBZ is used at least at WFO Topeka where meteorologist Bill Gargan performed a local study that identified 62 dBZ as a mean threshold for thunderstorms containing large hail. • The 50 dBZ at the -30 C height is in use at WFO Springfield, MO. • The Column Max is a variant of these two ideas. From operational experience, storms that contain severe hail often have a high dBZ core somewhere within the storm. • Another reason for looking at Column Max is due to “super-res” data. Many operational forecasters have noticed the “hotter” reflectivity returns and we wanted to capture a distribution of the maximum dBZ. • A box and whisker plot of these data follow:
-20C, -30C and Column Max dBZ • The -20 and -30 C level dBZ have been used with some success at least at WFOs TOP and SGF, however no known published data exists supporting these techniques. • It is theorized that the 25th percentile will show the most skill as a severe thunderstorm warning threshold for 1.00” hail, but this needs tested in an operational setting. • An interesting note on the CZ distribution is that 25% of these cases had a max dBZ core of 70 dBZ or greater. From operational experience, with legacy reflectivity resolution, a 70 dBZ core was relatively rare, it seems more common now that we see “super-res” data.
Storm Top Divergence • Median of the data: 79.5 kts • 25th Percentile: 60 kts • Due to the high spread in our dataset, we cannot recommend using STD alone as a good predictor of 1.00” hail. • It does have utility as used in Boustead’s 2008 research. More work needs to be done in our study to assess the data and analyze only storms with good WSR-88D sampling at the top.
Summary • We have evaluated several different techniques that use WSR-88D base moments of data to detect thunderstorms capable of producing 1.00” hail. • Of the 6 techniques evaluated, we are recommending 4 for testing in warning operations. Those techniques are: • 50 dBZ height compared to the melting level • 60 dBZ height compared to the melting level • The dBZ at the -20 C level • The dBZ at the -30 C level • An effective method for identifying severe hail within a thunderstorm will be a technique that balances a high POD against a low FAR. • The 25th percentile recommendations are only a starting point. Through testing this threshold may be changed to maximize forecast skill.
Summary • For testing we will be developing a questionnaire to formally collect data on how these 4 methods are performing operationally. • During an event, we suggest volunteers select only one method for testing. The thinking is that multiple methods will be too confusing during busy warning operations. • After the event is over, we’d ask volunteers to fill out the short questionnaire in order to evaluate how efficiently their method of choice is working out. • NOTE: • These methods are NOT meant to diagnose thunderstorms capable of producing severe winds or tornadoes. • If choosing a melting level vs. height method, the warning forecaster must remain cognizant of environmental conditions. The melting level can change significantly with space and time during an event.
Future Work • As mentioned previously, we plan to include 2009 data. • The most important component of future work in this study is testing suggested techniques in an operational setting. • We would like to solicit assistance from operational forecasters within the Southern Plains to test our techniques during warning operations. • If you are willing to help, please email us and we will send a questionnaire.