Download
1 / 27
270 likes | 351 Views
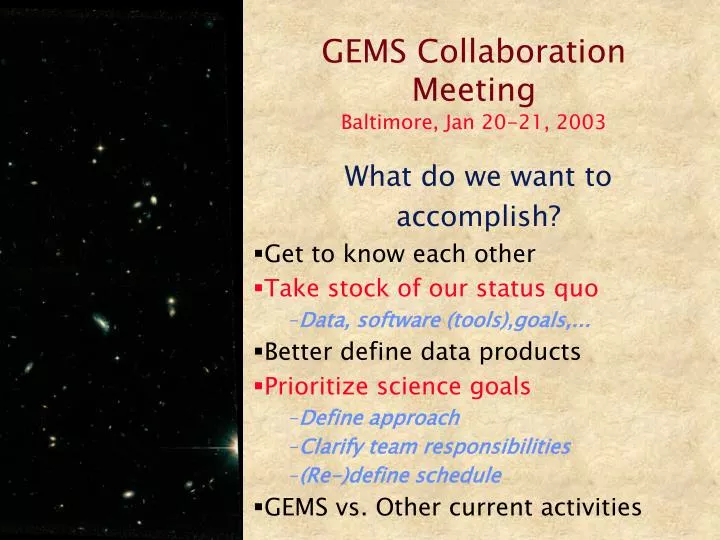
GEMS Collaboration Meeting Baltimore, Jan 20-21, 2003. What do we want to accomplish? Get to know each other Take stock of our status quo Data, software (tools),goals,... Better define data products Prioritize science goals Define approach Clarify team responsibilities

E N D
GEMS Collaboration MeetingBaltimore, Jan 20-21, 2003 What do we want to accomplish? Get to know each other Take stock of our status quo Data, software (tools),goals,... Better define data products Prioritize science goals Define approach Clarify team responsibilities (Re-)define schedule GEMS vs. Other current activities
Galaxy Population over the last 10 Gyrs • How many stars have formed since z~1.2 ? • In which Galaxies? • Mostly during in star-bursts, or “quiescently”? • Which galaxies are “old” already? • How did the clustering of galaxies evolve ? • Mass clustering vs. galaxy bias. • Always a morphology-density relation? • When and how did bulges and disks form ? • How did the merger rate evolve? • Is there an „angular momentum“ problem • Do disks grow inside out? • What makes AGNs light up? • Dramatic drop in AGN lum. density since z~1
What Data do we Need ?(to tackle this via “look-back” observations) Galaxy properties as a function of: • Redshift/Epoch with Dt/tH ~1 Note: z=1.2 t look-back = 10 Gyrs • Luminosity • Spectral Energy Distribution (SED) • Internal structure (size, bulge-to-disk, etc.) • Environment a multi-dimensional parameter space + account for large-scale fluctuation in the galaxy and mass distribution. +include “typical” galaxies at all epochs i.e. reach below L* at all redshifts
Survey Requirements Several 10,000 galaxies with • Redshifts to z>1 (good to a few percent) • Faint flux limit mr~24 • SEDs, including (rest-) UV and optical Several large fields • Co-moving size > 5 Mpc High-resolution (0.1”) imaging • typical scale lengths are 0.3 asec • two-color rest-frame B at all z
Existing Faint Surveys • CFRS • Lilly, LeFevre, et al. • I<22.5, 591 galaxies • CNOC2 • Yee, Carlberg etal. • R<21.5, z<0.55,2000 galaxies • HDF • Williams etal., Cohen etal. • redshifts for 200 objects • Medium Deep Survey – Keck spectroscopy
Status quo: Bulge-Disk Fitting:GIM2D(Simard etal 1999) Data: somewhat heterogeneous HST imaging
Status quo: Disk size functionLilly et al 1998 HST images of CFRS galaxies
Surveys at Hand • COMBO-17 C. Wolf, K. Meisenheimer(co-PIs), E. Bell, C. Maier, H.-W. Rix, S. Phleps, A. Borch + Edinburgh, Bonn • Data from WFI at the MPG/ESO 2.2m on La Silla • GEMS • 2-color, deep HST/ACS mosaic ( ~180 x HDF area)
GEMS: Key to “internal structure”(Galaxy Evolution fromMorphology and SEDs) • Large HST program (125+50 orbits) to image “extended-Chandra-Deep-Field-South” • 10,000 redshifts from COMBO-17 • 9x9 ACS tiles 150 x HDF • V and z • Limit: mz~27.5
GEMS 58 1.5% of total
..and we do have the redshifts.. ~1.2´x 2.2´ (0.003 of the total field)
GEMS: Top-Level Project Steps • Image acquisision, reduction • Object Detection+Match-up • Fitting/Morphology quantification • Selection/fitting simulation • Structural „master catalog“ • Empirical results • Link to theoretical predictions • Model-dependent results
GEMS vs past work • 30-fold number increase • Well defined sample with ample external information • z-band ACS imaging
Our competitive edge • COMBO-17 full catalog not yet published • GEMS mosaic largest HST image mosaic of sufficient depth (perhaps for a while...) • Comprehensive team experience BUT..... • GEMS data instantly public • With DEEP and VMOS, the COMBO-17 data will loose their uniqueness within a year
Top-Level Science Goals • How did stellar disks evolve/grow? • (Disk) size function • L vs reff , Tully-Fisher • Evolution of bulges/ellipticals • B/D ratios, growth of „old“ pops. • L vs reff , fundamental plane • Evolution of merger rate vs star burst rate • Did „internal evolution“ play a role? • Bar statistics • When are galaxies AGNs? • Host galaxies
What do we want to accomplish? Get to know each other Take stock of our status quo Data, software (tools), responsibilities Better define data products Prioritize science goals Define approach Clarify responsibilities (Re-)define schedule set of possible 1.generation papers GEMS vs. Other current activities
Spectroscopy goals forCOMBO-17/GEMS (stellar) masses from SEDs, spectra and kinematics Star-formation rates and metallicity Interaction rates – local velocity dispersion • Redshifts • outliers? • present median precision 180 Mpc • GEMS image contains 6 x more galaxies with good photometry • Spectral features • Balmer emission/absorption lines • AGN vs. star-formation diagnostics • Kinematics • Stellar and emission lines