Download
1 / 43
430 likes | 442 Views
Renewable Energy: Overview. Wim C. Turkenburg Copernicus Institute for Sustainable Development and Innovation Utrecht University The Netherlands Unicamp, Campinas, Brazil 19 February 2002. WORLD ENERGY ASSESSENT. Chapter 5: Energy Resources ( Hans-Holger Rogner) Chapter 7:

E N D
Renewable Energy: Overview Wim C. Turkenburg Copernicus Institute for Sustainable Development and Innovation Utrecht University The Netherlands Unicamp, Campinas, Brazil 19 February 2002
Chapter 5: Energy Resources (Hans-Holger Rogner) Chapter 7: Renewable Energy Technologies (Wim C. Turkenburg) Lead authors chapter 7: - Jos Beurskens - André Faaij - Peter Fraenkel - Ingvar Fridleifsson - Erik Lysen - Davis Mills - Jose Roberto Moreira - Lars Nilsson - Anton Schaap - Wim Sinke Renewable Energy & WEA
Advantages Renewables • Improving access to energy sources • Diversifying energy carriers • Balancing the use of fossil fuels • Reducing dependence on imported fuels • Reducing pollution from conventional energy systems • Suited to small and large scale applications
Disadvantages Renewables • Technologies often capital intense • Energy costs often not (yet) competitive • Diffuse energy source: spatial requirements • Environmental concerns (hydro, wind, biomass) • Intermittent character (wind, solar)
Present contribution Renewables World primary energy consumption in 1998 ______________________________________________________________________________________________ Fossil fuels: 320 EJ (80%) - oil 142 EJ - natural gas 85 EJ - coal 93 EJ ______________________________________________________________________________________________ Renewables: 56 EJ (14%) - large hydro 9 EJ - traditional biomass 38 EJ - ‘new’ renewables 9 EJ ______________________________________________________________________________________________ Nuclear: 26 EJ (6%) ______________________________________________________________________________________________ Total: 402 EJ (100%)
Biomass energy conversion • Sources: • plantations • forests residues • agricultural residues • municipal waste • animal manure • etcetera
Biomass energy conversion • Production of heat: improved stoves, advanced domestic heating systems, CHP. • Production of electricity: (co-)combustion, CHP, gasification (BIG-CC, engines), digestion (gas engines). • Production of fuels: ethanol, biogas, bio-oil, bio-crude, esters from oilseeds, methanol, hydrogen, hydrocarbons. Produced by: extraction, fermentation, digestion, pyrolysis, hydrolysis, gasification and synthesis.
Status biomass energy • Cost biomass from plantation already favourable in some developing countries (1.5-2 $/GJ). • Electricity production costs of 0.05-0.15 $/kWh. • New technology (BIG-CC) needed to reduce electricity production costs to 0.04 $/kWh. • Advanced technologies to produce bio-fuels (methanol, hydrogen, ethanol) at competitive cost (6-10 $/GJ).
Biomass energy development strategies • More experience with, and improvement of,the production of energy crops. • Creating markets for biomass. • Development and demonstration of key conversion technologies. • Poly-generation of biomass products and energy carriers from biomass. • Policy measures like internalizing external costs and benefits.
Modern wind farmssome key figures • On land wind farms: capacity varying from 1 MW to 100 MW(Spain even 1000MW) • Typical ex-factory price: US$350 to 400 per m² rotor swept area • Installed power varying from 400 W/m² (low wind speed area) to550 W/m² (high wind speed area) • Present most applied turbines: 0.6 MW to 1.5 MW (or approx. 43 mØto 60 mØ).
Market developmentsome key figures • Total installed power 23,300 MW (end 2001, world). • 82% of power in only 5 countries (D, DK, E, USA, India) • Growth during last 5 years: > 30 %/year. • ‘Progress’ factor: 80 %. • Energy pay back time: 0.25 - 0.5 years. • Technical life time: 20 years.
Future development wind • Wind turbines become larger. • Wind turbines will have fewer components. • Special offshore designs. • 10 percent grid penetration maybe around 2020. • Installed capacity in 2030 could be 1,000 – 2,000 GW. • Potential development energy production costs: 0.05 –> 0.03 $/kWh (+ 0.01 $/kWh for storage).
Solar PV stand-alone systems • consumer products • telecom • leisure • water pumping • lighting & signalling • rural electrification • etc. Solar Home System (Bolivia) PV-pumped cattle drinking trough (NL)
Grid-connected PV systems • building- & infrastructure-integrated PV • roofs • facades • sound barriers • etc. • ground-based power plants “City of the Sun” 50,000 m2 PV (NL) PV sound barrier (NL) “PV gold” (Japan)
300 275 250 225 200 175 150 125 100 75 50 25 0 1988 1989 1990 1991 1992 1993 1994 1995 1996 1997 1998 1999 2000 3 4 4.7 5 4.6 4.4 5.6 6.35 9.75 9.4 18.7 20.5 23.42 ROW 6.7 7.9 10.2 13.4 16.4 16.55 21.7 20.1 18.8 30.4 33.5 40 60.66 Europe 12.8 14.2 16.8 19.9 18.8 16.7 16.5 16.4 21.2 35 49 80 128.6 Japan 11.1 14.1 14.8 17.1 18.1 22.44 25.64 34.75 38.85 51 53.7 60.8 74.97 USA 33.6 40.2 46.5 55.4 57.9 60.09 69.44 77.6 88.6 125.8 154.9 201.3 287.65 Total PV market growthshipments per year (MW)
Status Solar PV • Conversionefficiencies of PV modules ranging from 6-9% (a-Si) to 13-15% (x-Si). • Many PV technologies under development. • Increase PV shipments (50 MW in 1991; 150 MW in 1998; 280 MW in 2000). • Continuous reduction investment costs (learning rate ~20%). • > 500.000 Solar Home Systems installed in last 10 years.
Potential development Solar PV • Investment costs grid-connected PV-systems may come down from 5-10 $/W –> 1 $/W. • Energy payback time may come down from 3-9 years –> 1-2 years (or less). • Electricity production costs may come down from 0.3-2.5 $/kWh –> 0.05-0.25 $/kWh. • PV can play a major role in rural electrification.
Future of PV: some conclusions • PV technically sufficiently mature for large-scale use. • large room for improvement in cost (x 1/5) and performance (x 2). • major contribution (EJ, CO2) from PV requires long-term approach, but: • great commercial, economic, and development opportunities.
Solar Thermal Electricity • Production of high temperature heat, using concentrating systems, to generate electricity • Applicable in sunnier regions • All technologies rely on four basic elements: - collector / concentrator - receiver - transport / storage - power conversion
Solar Thermal Electricity • Single Axis Tracking: Through system • commercial available since 1980’s • current energy costs 0.12-0.18 $/kWh • potential energy costs 0.06 $/kWh
Solar Thermal Electricity • Two Axis Tracking: Solar Tower • started 1980’s, several built • Illustration: Solar One 10 MW plant (Barstow, California, 1982-1988) • Solar Two recently demonstrated molten salt heat storage, delivering power to the grid on a regular basis
Solar Thermal Electricity • Two Axis Tracking: dish / heat engine power plant • several prototypes operated successfully in last 10 years. • size prototypes: ~ 400 m2; 10 kWe. • 2-3 MWe dish plant under development, attached to existing power plant.
STE: some conclusions • Installed STE capacity about 400 MWe (1 TWh/y) may grow to 2000 MWe in 2010. • Solar fields can be integrated into fossil fuel power plants at relatively low cost. • STE conversion efficiency may increase from 13-16% in near term to 16-20% in long term. • Electricity production costs may come down from 0.12-0.18 $/kWh today to 0.04-0.10 $/kWh in long term.
Low Temperature Solar Energy • World’s commercial low-temperature heat consumption: 50 EJ/y for space heating and 10 EJ/y for hot water production. • Low and medium temperature process heat consumption (up to 200 °C): 40 EJ/y. • Demand can be met partially with solar energy. • Mismatch between demand and supply requires heat storage.
Low Temperature Solar Energy • Solar Domestic Hot Water system (SDHW) • Collector area per system 2-6 m2. • Energy cost 0.03-0.25 $/kWh. • Solar fraction 50-100%. • Collector area installed is about 30,000,000 m2, equivalent to 18,000 MW, generating 50 PJ heat per year.
Low Temperature Solar Energy • Large water heating system • Around one-tenth of total installed area. • Wide spread use in swimming pools, hotels, hospitals, … • Cost per kWh somewhat less than for SDHW systems
Low Temp. Solar Energy Technologies Other options: • Solar space heating (solar combi-systems). • District heating (central collector area). • Heat Pumps (tens of millions installed). • Solar cooling (poor economics today). • Solar cooking (over 450,000 box-cookers in India). • Solar crop drying (over 100,000 m2 installed). • Passive solar energy use (new building design).
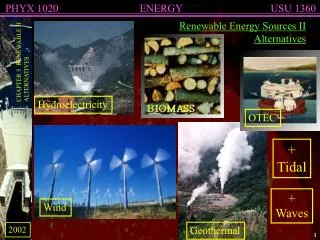
Hydro-electricity Salto Caxias hydro plant. More than 30% of total investment budget allocated to 26 socio-environmental projects
Electricity from hydropower • Large-scale systems: • 640 GW installed • 2,510 TWh/year • ______________________________________________Small-scale systems: • 23 GW installed • 90 TWh/year • Figures 1997 PRIMARY SOURCES OF ENERGY FOR WORLD ELECTRICITY GENERATION Coal Hydro Nuclear Natural Gas Oil based
Hydropower: some conclusions • Production may increase to 6000 TWh in 2050. • Technologies available to reduce social and ecological impacts. • Hydropower plants are capital intensive. • Large scale systems: mature technology, unlikely to advance. • Electricity production costs 0.02-0.10 $/kWh. • Additional advantages: operating reserve, spinning reserve, voltage control, cold start capability.
Geothermal Energy • Used for bathing and washing for thousands of years. • Used commercially for some 70 years • High temperature fields in more than 80 countries. • Low temperature resources found in most countries.
Some conclusions: 45 TWh produced in 1998 Electricity production cost: ~ 0.04 $/kWh Efficiency power plant: 5-20 % Accessible potential: 12,000 TWh/year Annual growth installed capacity: ~ 4 % Installed capacity in 1998: 8,240 MW USA: 2,850 MW Philippines: 1,848 MW Italy: 769 MW Mexico: 743 MW Indonesia: 590 MW Japan: 530 MW New Zealand: 345 MW Iceland: 140 MW Geothermal electricity production
Direct use of geothermal heat:some conclusions • Utilization in 1998: 40 TWh • Production cost: 0.005-0.05 $/kWh • Conversion efficiency: 50-70 % • Accessible resource base: 600.000 EJ • Annual growth installed capacity: ~ 6% • New challenge: geothermal heat pumps
Marine energy technologies • Tidal barrage energy • Wave energy • Tidal / marine currents • Ocean thermal energy conversion (OTEC) • Other options
Potential contribution renewables Shellscenario
Potential contribution renewables Potential contribution in second half of the 21th century: 20 - 50 % of total energy consumption. Transition to renewables-based energy systems relies on: - Successful development of renewable energy technologies that become increasingly competitive. • Removal of barriers to the deployment of renewables. • New policy instruments to speed-up the diffusion. - Political will to internalise environmental (external) costs that permanently increase fossil fuel prices.
Policy options: cost-buy-down and dissemination • Renewable Portfolio Standards (RPS) • Concessions • Green electricity market • Carbon dioxide tax • Subsidies with “sunset” clauses • Retail financing • Clean Development Mechanism