Download
1 / 70
700 likes | 702 Views
Explore the Inland Empire's booming economy, with record job growth, potential interest rate increases, and insights into key industries like healthcare, logistics, manufacturing, and construction.

E N D
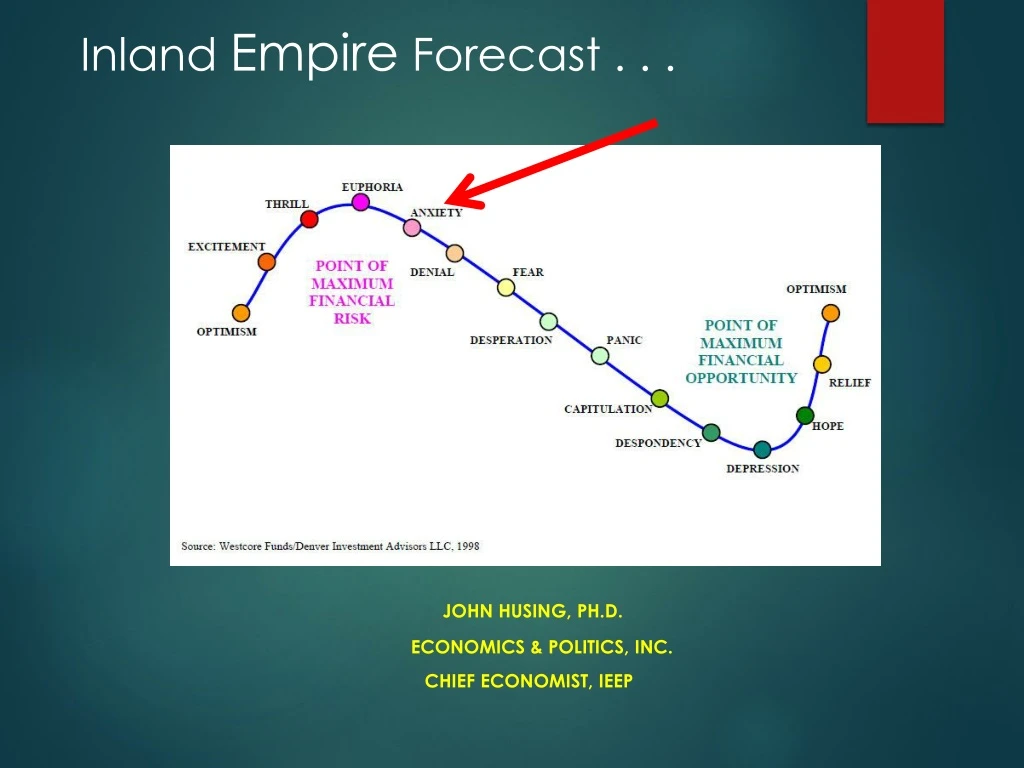
Inland Empire Forecast . . . John Husing, Ph.D. Economics & Politics, Inc. Chief Economist, IEEP
18.0% Add Potential Workers: Given Up Or Part Time 10.6% 8.0% 4.1%
Inflation Worry 3.9% 2.9%
3-4 Short Term Rate Increases Interest Rates: Fed Selling Off Q3 Balance Sheet … Raise Long Term Rates 5.0%?? 4.60% 2.91%
Yield Curve: Potential Recession Predictor 2 Year to 10 Year 0.41%
Inland Empire Population Greater Than 25 of 50 States
Inland Empire’s Powerful Job Growth! Percent 2017 above 2007 I.E. CA US 12.2% v. 8.8% v. 6.4% Confession Forecast: 46,600 jobs 3.3% 5.5% Unemployment Actual: 49,433 Jobs 3.5% 5.1% Unemployment
Job Growth by Region 2nd Largest 2017 Absolute Job Gain in CA!
Inland Empire Growth Fastest 2017 Job Growth Rate in CA!
Poverty 25.0% 17.5% 19.3% 14.5%
Educational Challenge 47.1% 45.7% 27.8% 29.8%
$ Payroll Spent $ Payroll Spent Moon Mining Corp. $ Payroll Paid
ACA Impact Health Care Demand & Quality of Life -60% Drop in Uninsured
Residents Per Health Care Worker +26.0% More People 33.5 26.6 Sources: Department of Finance, Demographic Research Unit; CA Employment Development Department
Health Care Job Growth Strongest High Paying Sector 2011-2017 10.3% of Job Growth
Median Health Care Pay: 2017 $60,768
E-Commerce 1.1% 9.1% 15.5%
Net Industrial Absorption 21.9 million
Industrial Rates & Vacancies Lease Rates Per Square Foot Per Month Inland Empire $0.53 3.9% Ventura $0.70 2.5% Los Angeles $0.89 1.1% Orange $0.91 1.5% San Diego $0.90 4.1% Source: CB Richard Ellis
Industrial Lease Rates Up 22.1% Up 76.7%
ONT Airport Cargo Record Volume 18.6%
Logistics Job Growth Without Logistics growth, IE would still be in Recession 2011-2017 23.3% of Job Growth
Median Logistics Pay: 2017 $46,708
Skill Ladders Based on Education for PositionMedian Pay Warehousing, Inland Empire 2017
CA Electrical Cost +71.3% +123.4% +147.6%
Manufacturing Job Growth 2011-2017 4.5% of Job Growth
Median Manufacturing Pay $51,385
Home Prices FHA Conforming Loan Limit: $405,950 LA/OC is $679,650 +3.7% -10.2%
Price Competition Highest Price Gaps In History
Apartment Rates/Vacancy, 2018 Inland Empire $1,239 7.0% Los Angeles $1,416 4.1% San Diego $1,577 4.8% Orange$1,736 3.8% Source: USC Lusk Center For Real Estate
Construction Job Growth 2011-2017 12.4% Of Job Growth
Median Construction Pay: 2017 Best Paying Blue Collar Sector $52,604
BA or Higher 21.4%