Download
1 / 41
410 likes | 548 Views
Bringing OR to the Frontline. Martin Rahman Donna Tranter David Fitzgerald Organisational Development West Yorkshire Police. Bringing OR to the Frontline. The Traditional Approach to Applying OR in WYP: Analysis undertaken in a ‘laboratory’ by specialist. OR Techniques Typically Used.

E N D
Bringing OR to the Frontline Martin Rahman Donna Tranter David Fitzgerald Organisational Development West Yorkshire Police
Bringing OR to the Frontline The Traditional Approach to Applying OR in WYP: Analysis undertaken in a ‘laboratory’ by specialist
OR Techniques Typically Used • Hard mathematical models - deterministic (e.g. a scientific law), statistical (e.g. based on observed data) or a combination • Discrete event simulation models • Static simulation -e.g. Excel • Continuous event simulations - e.g. SD Modelling • Softer representations of problem situations e.g. influence diagrams, process mapping, SSM etc. • Lean tools and techniques - e.g. process improvement • Multi Criteria Decision Analysis
Typical Applications • Force Call Bureau - resource optimisation • Response - Optimum Team Size against Demand Profiles • Firearms Support Unit - minimising the use of Divisional Firearms Officers - greater use of central team • Transport - Lean Review and Optimising Vehicle Allocation • SOCO - travel times and location • Custody - process/estate • Review of Divisional Policing Processes • Understanding of Unintended Impact of Alternative Resourcing Policies
Contact from the public Appropriate resource Scene attendance Assessment Deployment Assessment Trial (CPS) Crime recording File building Investigation Management Evidence assessment (force / CPS) Custodial Arrest Alternative disposal Custody Using SD to Understand Crime High level qualitative map – causal loop diagram Developed into Quantitative diagrams
Contact from the public Appropriate resource Scene attendance Assessment Deployment Assessment Trial (CPS) Crime recording File building Investigation Management Evidence assessment (force / CPS) Custodial Arrest Alternative disposal Custody Contact from the Public Witness based simulation modelling to determine resourcing levels based on historical demand Alternative ways of predicting demand e.g. temperature – 80% correlation Simulation models used as the basis of a shift roster – highlights problematic periods
Contact from the public Appropriate resource Scene attendance Assessment Deployment Assessment Trial (CPS) Crime recording File building Investigation Management Evidence assessment (force / CPS) Custodial Arrest Alternative disposal Custody Deploying Resources • Key characteristics: • Simulation Modelling • Optimisation • Process mapping • Performance Monitoring • Value Stream Analysis • Working Pattern Design Witness based simulation modelling to determine number of vehicles required – too complicated Off the shelf solution – Response Modeller
Using Lean to help maximise resource efficiency & productivity • Value Stream Mapping • The identification of waste through detailed data analysis • Use of Kaizen Blitz • Quest Projects
Response from Frontline • Not invented here resistance • Cultural acceptability / credibility of approaches • Uniqueness of problems – everyone’s different • Don’t like what we don’t understand • Loss of control in decision making • No incentive to adopt solutions locally • Leads to: • Partial / selective implementation of acceptable parts • Inefficient / ineffective resource usage (locally and the analytical team) • Resorting to local operational professional judgement • Constantly revisiting old problems
Our Response How to improve the acceptance and adoption of OR products without loss of reliability or quality
Bringing OR to the Frontline Supporting the Local Policing Review
Bringing OR to the FrontlineSupporting the Local Policing Review • Overview • Review of core operational service provision within 8 divisions - Response, Neighbourhoods and Investigations • Reshape policing services to identify most effective and efficient ways to meet demand, recognising local operational context • 8 divisional project teams - Local Ownership • Small Central Support Team to guide and co-ordinate - Business Change specialists and operational Inspectors • Two of the key principles were: • ‘Bottom-up’ - Optimising engagement with local operational staff • ‘Evidence Based’ - Demand driven both in terms of Managing, Reducing and Responding
Bringing OR to the FrontlineSupporting the Local Policing Review • Approach • Corporate Framework for local project teams comprising:- • - Phase One - Issue Identification, Validation and Opportunities for Change • - Phase Two - Business Case Development (Approved Changes) • - Phase Three - Implementation • Phase One - Completed 15 February 2013 • Focus placed on evidence to support issues identified, particularly current demand (internal and external) • Central Support Team - Provide OR and Lean capabilities but work with local teams in situ to develop their understanding and ownership of data • Scientific Demand Modelling - Data for modelling Response from Storm (Emergencies, Priorities and Standards) • Less Scientific - Significant number of Response additional tasks that were not recorded, including proportion of time spent
Bringing OR to the FrontlineSupporting the Local Policing Review • Response Modelling Approach • First attempt at modelling ‘Response’ since 2008 • Divisions provided with a single table of data showing team sizes and model output • Use of Process Evolution’s Response Modeller • Analysis of 1.5 million lines of incident data • All activity between ‘Code 5’ and ‘Code 2’ • Analysis of data is time consuming, however gives the most useful insight – would divisions benefit more from this insight rather than the overall results?
Bringing OR to the FrontlineSupporting the Local Policing Review • Additional Activities • Workshops with a cross-section of Response Officers to determine list of additional activities • Development of a ‘Survey Monkey’ form Sent to every Response Officer in the Force • Detailed activities identified and estimation of time spent on these activities over an average year • Provided the data to inform time spent on these activities used in conjunction with calculator – all divisions similar • Can be used to assess impact of any proposed demand / activity reductions e.g. Escort for Mental Health • Survey Monkey developed in the same way for Neighbourhoods and CID (Investigations) • Supported by Process Mapping and Analysis within the Divisions
Bringing OR to the FrontlineSupporting the Local Policing Review
Bringing OR to the FrontlineSupporting the Local Policing Review • Disseminating the work • Workshop with Local Teams to ‘train’ them in the use of the Response Calculator and help them understand Additional Task data • Additional Response Calculator Functionality introduced for Local Teams • Outcome - Widespread use of Divisional Models by the Local Teams - using to understand demand, potential for demand reduction, use of resources to meet demand, most appropriate shift patterns to align resources to demand etc.
Bringing OR to the Frontline Evolution of Custody – Phase 0-3
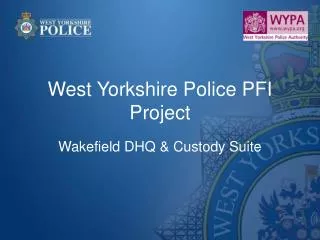
West Yorkshire Police Authority obligation to achieve ‘Best Value’- October 2005 ‘Safer detention and handling of persons in police custody’ doctrine - Early 2006 Recommended improvements to the current structure to increase operational effectiveness and processes for arrest and detention Phase 0 - Origins
Directive to reduce the number of custody suites Insufficient cells 13 suites, 239 cells Sufficient cells, wrong locations? Projected throughput growth of 10% per year 125,000 detainees Inadequate staffing profile 110 Custody Sergeants & 160 Detention Officers Inefficient processes 12 months to develop model and solutions Phase 0 - What were the objectives?
‘Hard Cell’ Gathering data Activity analysis Process complexities Getting the model to work ‘Hard Sell’ Resistance to change Confidence in underlying data Credibility of methodology / level of detail Phase 0 - What were the challenges?
Scenario testing Reduction of custody suites Reduction of custody staffing Alter ratio of Detention Officers and Sergeants Process led design - impact on arresting officers Number of cells required collectively and individually Provide assistance to other forces Phase 0 - How was the model used?
Phase 1 - Origins • Government Comprehensive Spending Review (CSR) savings requirement of £137million by 2016/17 • Pilot for Priority Based Budgeting (PBB) methodology
Directive to reduce the custody budget Too many cells 10 suites, 239 cells Projected throughput fall of 10% per year 105,000 detainees Inadequate staffing levels 69 Custody Sergeants & 220 Detention Officers Financially inefficient processes 3-4 months to present findings for a panel decision Phase 1 - What were the objectives?
‘Hard Cell’ Gathering data now more easily accessible Activity analysis no longer needed Process complexities removed or simplified Getting the model to work left to the NPIA ‘Hard Sell’ Much less resistance to change Increased confidence in underlying data Acceptance of methodology / level of detail Phase 1 - What were the challenges?
Numerous scenario testing No reduction of custody suites Significant reduction of custody staffing Alter ratio of Detention Officers and Sergeants to throughput Process already lean Phase 1 - How was the model used?
Phase 2 - Origins • Government Comprehensive Spending Review (CSR) savings requirement of £137million by 2016/17
Directive to further reduce the custody budget Too many suites? 9 suites, 252 cells Continued projected throughput fall of at least 10% per year? 85,000 detainees Lean staffing levels? 58 Police Officers & 176 Detention Officers 1 month to present initial findings Phase 2 - What are the objectives?
‘Hard Cell’ Easy pickings have already been realised ‘Hard Sell’ Significant time constraints Competing reviews Phase 2 - What are the challenges?
‘Out of the box’scenario testing Potential reduction of custody suites? Further reduction of custody staffing? Phase 2 - How was the model used?
Conclusion • Leadership increasingly seeking: • ‘Evidence based’ decisions • Greater involvement, ownership and acceptance of analysis • Quick solutions • We can retain integrity of OR ‘science’ within complex specialist models without losing their value to the manager who can understand and act on them
Any Questions? Martin Rahman Donna Tranter David Fitzgerald Organisational Development West Yorkshire Police