Download
1 / 21
210 likes | 274 Views
Introduction to the EKG. The contraction of any muscle is associated with electrical changes called depolarizations and can be detected by electrodes placed on the body.

E N D
The contraction of any muscle is associated with electrical changes called depolarizations and can be detected by electrodes placed on the body. Although the heart has 4 chambers, it can be thought of as having only 2 electrically as the atria contract together and then the 2 ventricles contract together. Electricity of the Heart
The natural pacemaker of the heart is called the sinoatrial node (SA node) located in the right atrium. The electrical impulse leaves the SA node (1) and travels to the right and left atria, causing them to contract together. This takes .04 seconds. There is now a natural delay to allow the atria to contract and the ventricles to fill up with blood. The electrical impulse has now traveled to the atrioventricular node (AV node) (2). Wiring of the Heart
The electrical impulse now goes to the Bundle of His (3), then it divides into the right and left bundle branches (4) where it rapidly spreads using Purkinje fibers (5) to the muscles of the right and left ventricle, causing them to contract at the same time.
Although the pacemaker cells create the electrical impulse that causes the heart to beat, other nerves can change the rate at which the pacemaker cells fire and the how strongly the heart contracts. These nerves are part of the autonomic nervous system and work with the “Fight or Flight” response.
“Rhythm” is used to refer to the part of the heart which is controlling the activation sequence. The normal heart rhythm beginning at the SA node is called sinus rhythm Electrical activation of the heart can sometimes begin in places other than the SA node as any of the electrical tissue in the heart has the ability to be a pacemaker. However, the SA node generates an electric impulse faster than the other tissue so it is normally in control. If the SA node should fail, the other parts of the electrical system can take over, although usually at a slower rate Rhythm of the Heart
An electrocardiogram is obtained by measuring electrical potential between various points of the body using a biomedical instrumentation amplifier. A lead records the electrical signals of the heart from a particular combination of recording electrodes which are placed at specific points on the patient's body.
· When a depolarization wavefront moves toward a positive electrode, it creates a positive deflection on the ECG in the corresponding lead. · When a depolarization wavefront moves away from a positive electrode, it creates a negative deflection on the ECG in the corresponding lead. · When a depolarization wavefront moves perpendicular to a positive electrode, it creates an equiphasic (or isoelectric) complex on the ECG. It will be positive as the depolarization wavefront (or mean electrical vector) approaches (A), and then become negative as it passes by (B).
EKGs record changes in electrical activity using a moving strip of paper. Each large square (5 mm) represents 0.2 seconds or 200 milliseconds equalling 5 large squares per second and 300 per minute. Times and Speeds
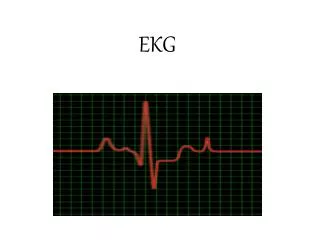
Wave Basics • All this activity produces electrical waves we can measure. The measurement is typically represented as a graph called an electrocardiogram (EKG).
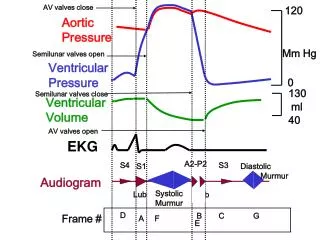
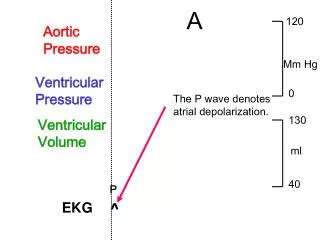
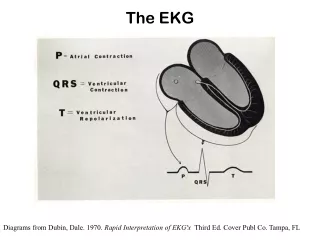
P wave - coincides with the spread of electrical activity over the atria and the beginning of its contraction. QRS complex - coincides with the spread of electrical activity over the ventricles and the beginning of its contraction. T wave - coincides with the recovery phase of the ventricles.
A typical ECG tracing of a normal heartbeat (or cardiac cycle) consists of a P wave, a QRS complex and a T wave. A small U wave is normally visible in 50 to 75% of ECGs.
Contraction of the atria is associated with the P wave. Because the atria are small so is the P wave. The ventricles are larger so there is a large deflection when the ventricles are depolarized – this forms the QRS complex. The T wave is caused by the return of the ventricles to the resting electrical state (repolarization). EKG Wave Shapes
A normal QRS complex is 0.06 to 0.10 sec (60 to 100 ms) in duration represented by three small squares or less, but any abnormality of conduction takes longer, and causes widened QRS complexes. Not every QRS complex contains a Q wave, an R wave, and an S wave any combination of these waves can be referred to as a QRS complex. QRS Abnormalities
The PR interval is measured from the beginning of the P wave to the beginning of the QRS complex. It is usually 120 to 200 ms long. On an ECG tracing, this corresponds to 3 to 5 small boxes The relationship between P waves and QRS complexes helps distinguish various ··cardiac arrhythmias. The shape and duration of the P waves may indicate atrial enlargement. A PR interval of over 200 ms may indicate a first degree heart block. P Wave Abnormalities
If the first deflection is downward it is called a Q wave. An upward deflection is called an R wave (with or without a preceding Q wave) Any deflection below the baseline following and R wave is called an S wave
The U wave is not always seen. It is typically small, and, by definition, follows the T wave. U waves are thought to represent repolarization of the Purkinje fibers in the left ventricle. Prominent U waves may be induced by medicines. Negative U waves at rest, may be the earliest marker of unstable angina and evolving myocardial infarction U Waves
A “Normal” Electrocardiogram http://img.tfd.com/dorland/thumbs/electrocardiogram.jpg
Sources: Electrocardiogram [Internet]. Wikipedia. United States [Accessed: November 8, 2008]. Available from: http://en.wikipedia.org/wiki/Electrocardiogram Barbara Aehlert. June 26, 2001 ECGs Made Easy. 2 edition. New York: Mosby. Cardiac Cycle [Internet]. United States [Updated 2000; Accessed November 10, 2008]. Available from: http://www.interactivephysiology.com/demo/systems/buildframes.html?cardio/cardcycl/01