Download
1 / 12
120 likes | 202 Views
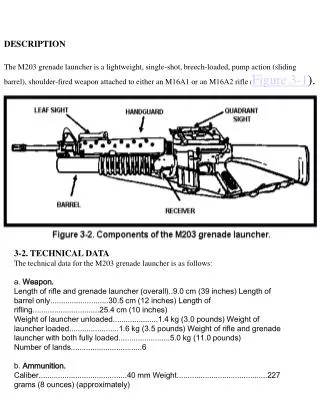
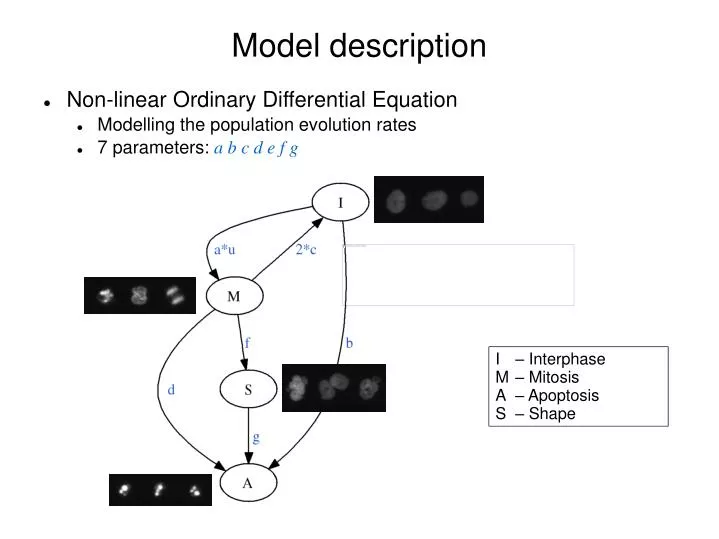
Model description. Non-linear Ordinary Differential Equation Modelling the population evolution rates 7 parameters: a b c d e f g. I – Interphase M – Mitosis A – Apoptosis S – Shape. Non-linear Ordinary Differential Equation model.

E N D
Model description • Non-linear Ordinary Differential Equation • Modelling the population evolution rates • 7 parameters: a b c d e f g I – Interphase M – Mitosis A – Apoptosis S – Shape
Non-linear Ordinary Differential Equation model • u is a non-observable 'negative growth pressure' function • Needed to model saturation due to cell contact inhibition • Without it, the system would be linear + 4 initial conditions
Fitting examples • No knockdown
Fitting examples • KIF11 knockdown (mitotic arrest phenotype)
Fitting examples • INCENP knockdown (shape phenotype)
Fitting examples • bCOP knockdown (apoptotic phenotype)
Expected parameters for known phenotypes • Mitotic arrest: lowc& highd • Shape: highf • Apoptotic: high b, dor g Marginal distributions Distribution of c Distribution of f Wild type Mitotic arrest Shape Wild type Mitotic arrest Shape
Automatic phenotyping: mitotic genes • Scoring each experiment • Scoring each siRNA • Median of replicates
Ranking by mitotic score • New mitotic hits: • ENSG00000197652 • ENSG00000178882 • TXNL4A • ASB2 • ENSG00000188329 • MTP18 • GPR19 • MGAT4B • ENSG00000140006
ENSG00000197652 • 3 siRNA • Score = 7.735 (no phenotype) • Score = 4.387 (no phenotype) • Score = 0.1424: score=0.1424 score=2.324 score=0.1041
GPR19 • 3 siRNA • Score=5.181 (no phenotype) • Score=12.41 (no phenotype) • Score=0.1869: score=0.078 score=0.2836 score=0.1869