Download
1 / 36
360 likes | 474 Views
Metro 2010-2045 Growth Distribution Process. Project Update to MTAC January 4, 2012. Process Outline and Schedule – page1. Process Outline and Schedule – page2. MetroScope – equilibrium supply and demand real estate forecast model

E N D
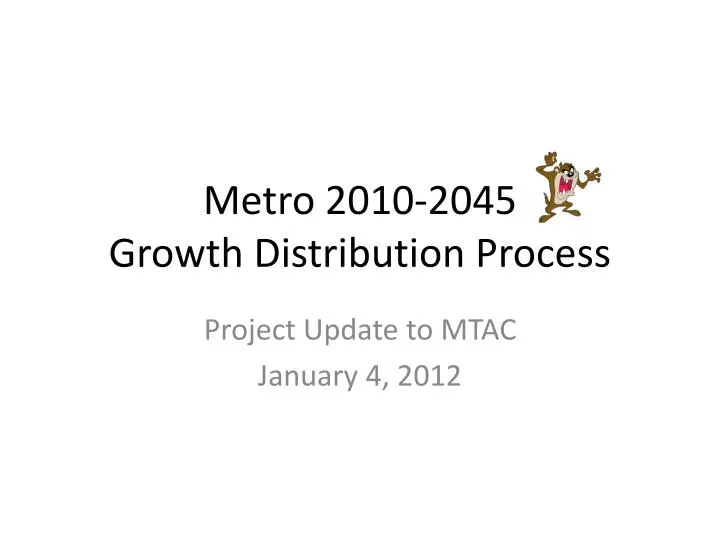
Metro 2010-2045 Growth Distribution Process Project Update to MTAC January 4, 2012
Process Outline and Schedule – page1 2010-45 Regional TAZ Forecast Allocation
Process Outline and Schedule – page2 2010-45 Regional TAZ Forecast Allocation
MetroScope – equilibrium supply and demand real estate forecast model Integrated land use & transportation model to forecast TAZ-level employment and households. Key forecast & policy assumptions: Zoning data Capacity (supply) information – residential and employment Regional forecast data (demand) Metroscope 2010-45 Regional TAZ Forecast Allocation
HIA Demand Forecast Travel Times/Access (Travel Demand Model) Job Demand Forecast HIA location choices Job location choices Job Location Choices MetroScope Residential Model MetroScope Non-Residential Model HIA Location Choices Land Supply / Capacity Data Vacant Land, Refill Supply, UR etc. MetroScope Model Schematic Demand Output Supply 2010-45 Regional TAZ Forecast Allocation
HIA Demand Forecast Travel Times/Access (Travel Demand Model) Job Demand Forecast MetroScope Residential Model MetroScope Non-Residential Model HIA Location Choices Land Supply / Capacity Data (MetroScope models the real estate demand factors) Metroscope: DEMAND DATA 2010-45 Regional TAZ Forecast Allocation
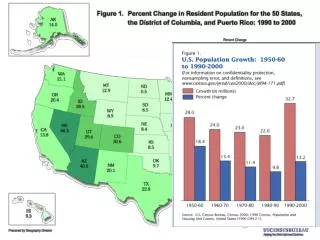
Demand Data: Population Forecast (PMSA) • Pt+1= Pt + bt – dt + mt (population eq.) (x-axis denominated in years) 2010-45 Regional TAZ Forecast Allocation
Demand Data: Population Forecast PMSA: Range Forecast Range ~ 2 std. dev. 2010 Population: 2,226,009 (Census) 2035 Population: 3,210,000 (yellow line) 2010-45 Regional TAZ Forecast Allocation
Demand Data: Population Forecast Metro Council opts in UGB decision: Lower middle-third forecast range point value is assumed for 2010-45 TAZ Forecast (Gamma 2.0) Lower middle-third forecast range point value Standard Deviation 2010-45 Regional TAZ Forecast Allocation
Demand Data: Population Forecast Convert household count to HIA distributions • Iterative techniques use • 2000 Census PUMS data to estimate households by : • Household size (7) • Income bracket (16) • Age of household head (7) 2010-45 Regional TAZ Forecast Allocation
Demand Data: Employment Forecast PMSA: Range Forecast Range ~ 2 std. dev. 2010 Population: 2,226,009 (Census) 2035 Population: 3,210,000 (yellow line) 2010-45 Regional TAZ Forecast Allocation
Demand Data: Employment Forecast 2010-45 Regional TAZ Forecast Allocation
HIA Demand Forecast Travel Times/Access (Travel Demand Model) Job Demand Forecast MetroScope Residential Model MetroScope Non-Residential Model HIA Location Choices Land Supply / Capacity Data (MetroScope models the real estate supply-side capacity components) Metroscope: supply data 2010-45 Regional TAZ Forecast Allocation
Supply Data: MetroScope Capacity Concepts 2010-45 Regional TAZ Forecast Allocation
Supply Data: Metro UGB Residential 2010-45 Regional TAZ Forecast Allocation 2010-45 Regional TAZ Forecast Allocation
Supply Data: Metro UGB Non-Res. 2010-45 Regional TAZ Forecast Allocation
Supply Data: Subsidized Redevelopment 2010-45 Regional TAZ Forecast Allocation
Supply Data: Metro Urban Reserves 2010-45 Regional TAZ Forecast Allocation
Supply Data: Ex-UGB Capacity 2010-45 Regional TAZ Forecast Allocation
Supply Data: Clark County Clark County Residential DU Capacity Estimates: SF = 67,000 MF=45,700 2010-45 Regional TAZ Forecast Allocation
Supply Data: Residential Capacity (PMSA) 2010-45 Regional TAZ Forecast Allocation
Supply Data: Capacity by Type (UGB) 2010-45 Regional TAZ Forecast Allocation
Supply Data: Single Family Capacity (UGB) 2010-45 Regional TAZ Forecast Allocation
Supply Data: Multi-family Capacity (UGB) 2010-45 Regional TAZ Forecast Allocation
HIA Demand Forecast Travel Times/Access (Travel Demand Model) Job Demand Forecast MetroScope Residential Model MetroScope Non-Residential Model HIA Location Choices Land Supply / Capacity Data Travel time skims linked to residential zones are a factor in determining residential location choice Metroscope travel demand data 2010-45 Regional TAZ Forecast Allocation
Travel Demand Data: Travel Times Travel Time from Portland CBD Modeled 2010 2-hour PM Peak An example of typical travel time O-D pairings between downtown Portland and elsewhere in the region 2010-45 Regional TAZ Forecast Allocation
Travel Demand Data: Travel Times Travel Time from Wilsonville Modeled 2010 2-hour PM Peak 2010-45 Regional TAZ Forecast Allocation
Travel Demand Data: Travel Networks Networks in TAZ GAMMA Forecast 2010 existing 2017 network 2035 RTP Federal (Constrained) 2035 RTP State (Strategic) 2010-45 Regional TAZ Forecast Allocation
HIA Demand Forecast Travel Times/Access (Travel Demand Model) Job Demand Forecast MetroScope Residential Model MetroScope Non-Residential Model HIA Location Choices Land Supply / Capacity Data An equilibrium solution (balancing supply and demand for housing) is derived from the regulated buildable land inventory (BLI) and Metro “lower middle-third” regional population & employment forecast. METROSCOPE LAND USE TAZ ALLOCATION FORECAST 2010-45 Regional TAZ Forecast Allocation
Recap and Next Steps • Progress to date - accomplishments • Concerns (next slide) • Research agenda to address concerns 2010-45 Regional TAZ Forecast Allocation
Gamma 1.0 TAZ Forecast: Preliminary Forecast Key Concerns - Forecast Inputs and Assumptions: • Single family housing supply • Equity and price effects (economic dislocations) • Redevelopment (economic thresholds) • Redevelopment of relatively new development • Mixed use residential (horizontal districts) • Mixed use residential density assumptions (MUR 9-10) • Market differentiation by household type, tenure and location 2010-45 Regional TAZ Forecast Allocation
Research Agenda • Proposed improvements to the forecast distribution process:* • Residential choice study enhanced with market segmentation • Redevelopment supply assumption refinement • Review actual development densities in high density multifamily and mixed use residential zone classes *depending on funding availability 2010-45 Regional TAZ Forecast Allocation
Examples illustrating key concerns – SINGLE FAMILY, FUTURE PRICING TRENDS AND EQUITY
Beta TAZ Forecast: Preliminary Household Forecast – SFR/MFR splits 2010-45 Regional TAZ Forecast Allocation
Beta TAZ Forecast: Preliminary Household Forecast – SFR Price Projection • SF inventories are expected to dwindle faster than replenishment rates • Causing a surplus in SF residential demand • Resulting in further increases in SF home prices over the forecast 2010-45 Regional TAZ Forecast Allocation
Beta TAZ Forecast: Preliminary Household Forecast (SF) 2010-45 Regional TAZ Forecast Allocation