Download
1 / 113
1.15k likes | 1.34k Views
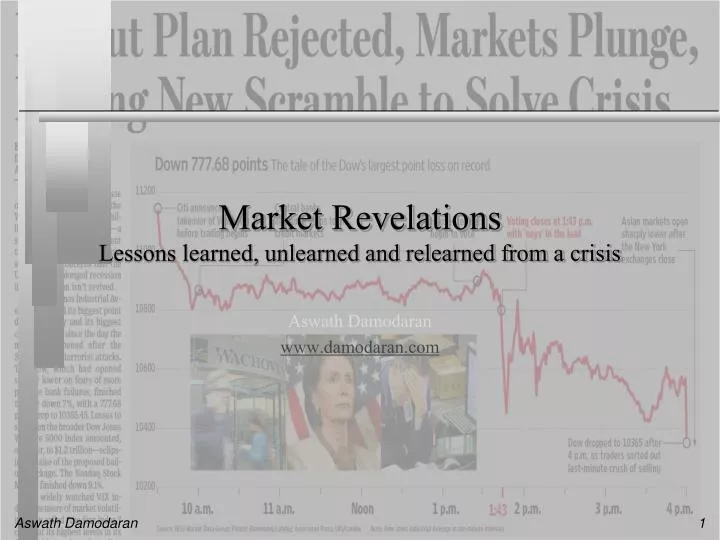
Market Revelations Lessons learned, unlearned and relearned from a crisis. Aswath Damodaran www.damodaran.com. We learned about risk…. And that a lemming in a fancy car is still a lemming. The fundamentals. The more things change, the more they stay the same….

E N D
Market RevelationsLessons learned, unlearned and relearned from a crisis Aswath Damodaran www.damodaran.com
The fundamentals The more things change, the more they stay the same…
DCF Choices: Equity versus Firm Firm Valuation: Value the entire business by discounting cash flow to the firm at cost of capital Equity valuation: Value just the equity claim in the business by discounting cash flows to equity at the cost of equity
I. The Riskfree Rate You are valuing Embraer in US dollars. Which of the following would you use as your riskfree rate in your valuation? • The rate on the 10-year US Treasury Bond (3.5%) • The rate on the 10-year Nominal $R Brazilian Government Bond (9.5%) • The rate on the 10-year US dollar denominated Brazilian Government Bond (6%) • The rate on the 10-year Inflation Indexed US treasury bond (1.5%) • None of the above Would your answer be different if you were valuing Embraer in nominal $R? How about if you were valuing Embraer in real terms?
Lesson 1: Nothing is risk free? The market view of US treasuries…
And the consequences.. • Reserve Fund “breaks the buck” On Wednesday, September 17, the Reserve Primary Fund had $62.6 billion in assets, making it one of the largest money-market funds.. At least a dozen large investors pulled out almost $40 billion of their money Monday and Tuesday, two-thirds of Primary Fund's formidable asset base. That pushed the fund's per-share price down to $0.97, a bracing signal to investors and a jolt to money-market investors world-wide. The withdrawals meant the Primary Fund had to "break the buck.” That is, its net asset value sunk below the time-honored standard of$1 a share. • Treasury bill rates drop to zero… on Sept 17
Response 1: From government bond rates to riskfree rates… • The Brazilian government had 10-year nominal $R bonds outstanding, with a yield to maturity of about 10.25% on January 1, 2009. In January 2009, the Brazilian government had a local currency sovereign rating of Ba1. The typical default spread (over a default free rate) for Ba1 rated country bonds in early 2009 was 3%. The risk free rate in nominal $R is • The yield to maturity on the 10-year bond (10.25%) • The yield to maturity on the 10-year bond + Default spread (13.25%) • The yield to maturity on the 10-year bond – Default spread (7.25%) • None of the above
Why do riskfree rates vary in the first place?… and why does it matter?
Response 2: A framework for picking the right riskfree rate…
II. The Equity Risk Premium: Trusting history? Historical premium in January 2008 Historical premium in 2009 Historical premium in January 2009
Or the market?: Implied equity risk premiums in 2008 vs 2009 Expected Return on Stocks (1/1/08) = 8.39% Equity Risk Premium = 8.39%-4.02% =4.37%
Lesson 2A: ERPs can change even in mature markets: 9/12/2008 – 12/31/2008
And even more so in emerging markets… The markets that saw the biggest changes in equity risk premiums were the emerging markets that had also benefited the most from the pre-crash drop in premiums…
Response 2A: Update your numbers:Implied Equity Risk Premiums(Subtext: Do not trust historical risk premiums) • For the US, in July 2009 • S&P 500 was at 884 • Dividends and Buybacks had dropped to 46.5 (about 5.26% of the index) • Expected growth in earnings for next 5 years was at 4.5% • The treasury bond rate was at 3.5% • Implied equity risk premium on July 8, 2009 = 6.06% • For Brazil, in July 2009 • Bovespa was at 50,500 • FCFE was at about 8% of the index • Expected growth in earnings for next 5 years was at 7% • The treasury bond rate was at 3.5% • Implied equity risk premium on July 8, 2009 = 9.69%
Response 2B: Don’t trust (or use) book costs of debt… even for unrated companies.. • Many practitioners use the book cost of debt, computed by dividing the interest expenses by the book value of debt, to estimate the cost of capital. Implicit in this practice are two assumptions: • The cost of debt for most companies (at least mature ones) does not change much over time. • The book cost of debt is the actual cost that the company has to pay • If a company has no bonds or rating, there is no choice • While this practice has always been sloppy, its inadequacy has been laid bare by the crisis. • Even if a company’s rating did not change over 2008, its cost of borrowing new funds would have changed significantly • If you are valuing a firm, you have to consider the current cost of borrowing, not a historical cost.
Lesson 2C: Equities, Bonds and Real EstateAll Risky Investments!
Consequences for Cost of Capital:Beta =1, Rating of BBB, tax rate of 40% and a 30% debt ratio On September 12, 2008 On June 15, 2009 Riskfree rate = 3.5% ERP = 6% Default spread (BBB)= 3% Cost of Equity = 3.5% + 6% = 9.5% Cost of Debt = 3.5% + 3% = 6.5% Cost of Capital = 9.5% (.7) + 6.5% (1-.4) (.3) = 7.82% • Riskfree rate = 4.5% • ERP = 4% • Default spread (BBB)= 1.5% • Cost of Equity = 4.5% + 4% = 8.5% • Cost of Debt = 4.5% + 1.5% = 6% • Cost of Capital = 8.5%(.7)+ 6% (1-.4) (.3) = 7% The composition of the cost of capital has changed: On Sept 12, 2008: Riskfree rate was 4.5%; Risk premium was 2.44% On June 15, 2009: Riskfree rate was 3.5%; Risk premium was 4.32% What are the implications?
Lesson 3A: The line between firm specific and market risk can be murky.. The classic point of view: Market risks come from macro variables and what firms do to enhance their profits/value falls under firm specific risk. Lehman’s woes can be traced to large bets made by the firm in the CDS and deriviatives market. If we stayed with classical finance, this seems to clearly fall under firm specific risk but… Too big to fail? Systemic risks? All of these are really debates about when firm specific risk becomes market risk.
Lesson 3B: The limits of diversification.. • Diversification has always been the mantra in investing. If you stay diversified, we have been told, your portfolio will be less risky since the correlation between asset classes is low. • The crisis of 2008 illustrated some of the limits of diversification. In this particular crisis, all risky assets (equities, bonds, real assets) dropped in value as investors reassessed the price of risk. The correlation across asset classes increased.
Lesson 3C: Even sector betas can change… • Estimates of sector betas at the start of 2008 and 2009: Betas went up for financial service firms, retailers and real estate related businesses and down for technology and health care.
Lesson 3D: Differences in risk/response widen during crisis… • The essence of risk and return models is that some stocks are riskier than others and that we have to measure relative risk with a beta or betas and incorporate that risk into expected returns. • In periods of stability, the relationship between betas and returns is weak. It is only during tumultuous periods (up or down) that the relationship reveals itself. Betas actually work better at explaining return differences during market crises.
Time for creative thinking on risk … • Average across firms and across time: Instead of using the sector average betas as bottom up betas, we should consider using the average across time for each sector. • Check against fundamentals: If the beta of a firm reflects the discretionary nature of its products, the betas we estimate for a sector should be a function of the elasticity of demand for the products/services provided by that sector. • Adjust for non-diversification: If the marginal investors in the firm are not diversified or only partially diversified, we have to incorporate that portion of the firm specific risk into the beta and cost of equity. • Check against implied betas: We can estimated implied expected returns for equity by sector, given how the market is pricing stocks in that sector and back out betas from these expected returns. We can compare these betas to the betas that we have estimated.
IV. Macro views • If you believe that interest rates will go up (down), that exchange rates will move adversely (in your favor) and that the economy will weaken (strengthen), should you try to bring them into your individual company valuations? • Yes • No • If you do, and you conclude that a stock is overvalued (undervalued), how should I read this conclusion?
Lesson 4: Macro variables behave strangely during crisis… On 1/1/09: 2.21%
Response 4: Keeping macro views out of your valuation has become more important than ever… • Selective normalization: Analysts often pick and choose which variables they want to normalize. Thus, they may decide that interest are too low and use higher rates. However, the lower riskfree rate in early 2009 was the result of the market crisis (and the flight to safety), and the crisis also affected equity risk premiums and default spreads (pushing them to new highs) and economic growth (to lows). If you raise the riskfree rate but leave equity risk premiums, default spreads and real growth untouched, you are creating an inconsistent valuation. • Macro and micro views: When the macro environment becomes unstable, there will be strong disagreements about where the economy, interest rates and exchange rates will go in the near and far future. It is therefore important to separate out your views on the macro economy from your views on a company, when you do valuation. A person looking at your valuation can then decide which of your views is reasonable and which ones are not.
V. Liquidity (or the lack thereof..): The conventional wisdom.. • The notion that investors care about liquidity is neither new nor revolutionary. The lack of liquidity of assets has been used to explain why these assets trade at a lower price or yield higher returns. • The literature has generally linked illiquidity to trading volume, arguing that it is markets (assets) where volume is low that we have to worry about illiquidity the most. Following through on this proposition: • Illiquidity is more of a problem with real asset markets (real estate, fine art) than for financial asset markets. • Illiquidity will affect value more in emerging markets than in developed markets. • Illiquidity should be greater factor for small cap companies than with large cap companies.
Lesson 5A: Even large cap stocks in developed markets can become illiquid.. • Panic selling.. • And buying…
Lesson 5C: With wildly divergent effects for different investors.. See Pedersen (2009)
Response 5A: Illiquidity has to be considered explicitly in valuation… for all companies.. • If we accept the premise that illiquidity can be a significant problem, even with large market cap companies, we have to consider ways in which we can explicitly incorporate the illiquidity risk into value. In general, we have two choices: • Adjust discount rates: As a general proposition, we could argue that illiquidity is a risk and that discount rates should be higher for illiquid companies. Holding cash flows constant, we will arrive at lower values for illiquid assets. • Reduce estimated value for illiquidity: Alternatively, we can ignore illiquidity while estimating value but discount the expected value for illiquidity (like private company practitioners have.
Response 5B: And vary across assets (companies)… • Liquidity as a source of market risk: We can extend traditional risk and return models (such as the CAPM) to consider illiquidity as a source of market risk. In practice, this would require us to estimate • An illiquidity beta for every asset, reflecting not only how illiquid an asset is but how that illkquidity correlates with market illiquidity • An illiquidity risk premium which will vary across time • Historical data: We can look at how the market has priced assets historically and try to back out how much of a discount it has attached to illiquid assets and how that discount varies across asssts. • Market based approach: Using observed stock prices, we can back out the implied illiquidity discount on estimated value for firms in different sectors (illiquidity classes).
VI. A year is not a trend… • In early 2009, Exxon and Petrobras reported the following (for the 2008 fiscal year) Exxon Mobil Petrobras Revenues $477 billion $R 215 billion EBIT (1-t) $ 58 billion $R 32 billion Net Cap Ex $ 3 billion $R 41 billion Chg WC $ 1 billion $R 3 billion FCFF $ 54 billion $R – 12 billion Exxon’s after-tax operating income doubled over the last 5 years Petrobras has seen a 50% increase in after-tax operating income over the last 5 years and a surge in exploration and reinvestment.
The conventional response: Normalize.. • When normalizing earnings, we have generally looked at • Historical values: Especially as we get deeper and richer data bases, we can look at historical averages for almost every input in valuation. • Industry averages: At the same time, as more firms get listed globally, we have industry averages for margins, returns and every other input in valuation. • Implicit in both approaches is the assumption of mean reversion, i..e, that there is a historic norm for most values that we converge back to. This assumption is backed up empirically. • Mean reversion can fail in spectacular fashion, if there is a structural break with the past. Holding on to the past, when the world has changed around you, is a recipe for disaster.