Download
1 / 1
10 likes | 123 Views
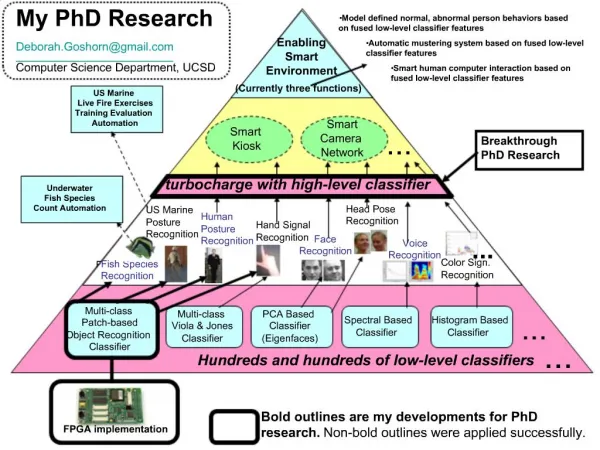
Species Identification of White Fish using PCR Techniques Erin Chase Advisor Dr. Tschunko. Methods Continued

E N D
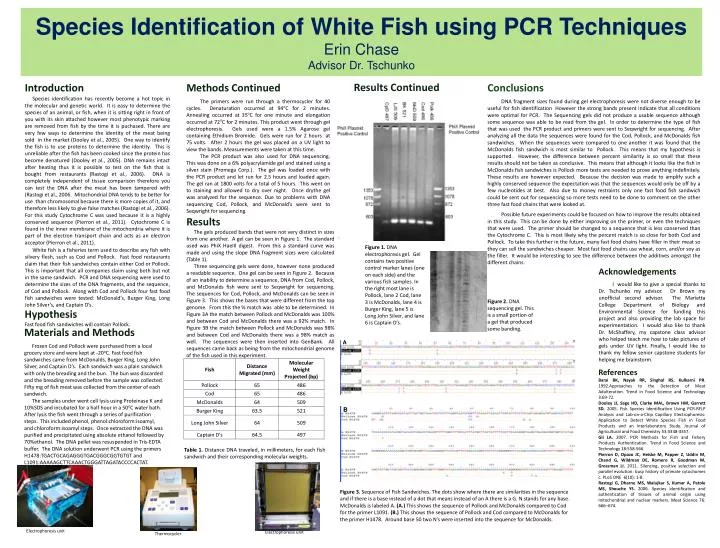
Species Identification of White Fish using PCR TechniquesErin ChaseAdvisor Dr. Tschunko Methods Continued The primers were run through a thermocycler for 40 cycles. Denaturation occurred at 94oC for 2 minutes. Annealing occurred at 35oC for one minute and elongation occurred at 72oC for 2 minutes. This product went through gel electrophoresis. Gels used were a 1.5% Agarose gel containing Ethidium Bromide. Gels were run for 2 hours at 75 volts. After 2 hours the gel was placed on a UV light to view the bands. Measurements were taken at this time. The PCR product was also used for DNA sequencing. This was done on a 6% polyacrylamide gel and stained using a silver stain (Promega Corp.). The gel was loaded once with the PCR product and let run for 2.5 hours and loaded again. The gel ran at 1800 volts for a total of 5 hours. This went on to staining and allowed to dry over night. Once drythe gel was analyzed for the sequence. Due to problems with DNA sequencing Cod, Pollock, and McDonald’s were sent to Seqwright for sequencing. Results Continued Introduction Species identification has recently become a hot topic in the molecular and genetic world. It is easy to determine the species of an animal, or fish, when it is sitting right in front of you with its skin attached however most phenotypic marking are removed from fish by the time it is puchased. There are very few ways to determine the identity of the meat being sold in the market (Dooley et al., 2005). One way to identify the fish is to use proteins to determine the identity. This is unreliable after the fish has been cooked since the protein has become denatured (Dooley et al., 2005). DNA remains intact after heating thus it is possible to test on the fish that is bought from restaurants (Rastogi et al., 2006). DNA is completely independent of tissue comparison therefore you can test the DNA after the meat has been tampered with (Rastogi et al., 2006. Mitochondrial DNA tends to be better for use than chromosomal because there is more copies of it, and therefore less likely to give false matches (Rastogi et al., 2006). For this study Cytochrome C was used because it is a highly conserved sequence (Pierron et al., 2011). Cytochrome C is found in the inner membrane of the mitochondria where it is part of the electron transport chain and acts as an electron acceptor (Pierron et al., 2011). White fish is a fisheries term used to describe any fish with silvery flesh, such as Cod and Pollock. Fast food restaurants claim that their fish sandwiches contain either Cod or Pollock. This is important that all companies claim using both but not in the same sandwich. PCR and DNA sequencing were used to determine the sizes of the DNA fragments, and the sequence, of Cod and Pollock. Along with Cod and Pollock four fast food fish sandwiches were tested: McDonald’s, Burger King, Long John Silver’s, and Captain D’s. Conclusions DNA fragment sizes found during gel electrophoresis were not diverse enough to be useful for fish identification However the strong bands present indicate that all conditions were optimal for PCR. The Sequencing gels did not produce a usable sequence although some sequence was able to be read from the gel. In order to determine the type of fish that was used the PCR product and primers were sent to Seqwright for sequencing. After analyzing all the data the sequences were found for the Cod, Pollock, and McDonalds fish sandwiches. When the sequences were compared to one another it was found that the McDonalds fish sandwich is most similar to Pollock. This means that my hypothesis is supported. However, the difference between percent similarity is so small that these results should not be taken as conclusive. This means that although it looks like the fish in McDonalds fish sandwiches is Pollock more tests are needed to prove anything indefinitely. These results are however expected. Because the decision was made to amplify such a highly conserved sequence the expectation was that the sequences would only be off by a few nucleotides at best. Also due to money restraints only one fast food fish sandwich could be sent out for sequencing so more tests need to be done to comment on the other three fast food chains that were looked at. Possible future experiments could be focused on how to improve the results obtained in this study. This can be done by either improving on the primer, or even the techniques that were used. The primer should be changed to a sequence that is less conserved than the Cytochrome C. This is most likely why the percent match is so close for both Cod and Pollock. To take this further in the future, many fast food chains have filler in their meat so they can sell the sandwiches cheaper. Most fast food chains use wheat, corn, and/or soy as the filler. It would be interesting to see the difference between the additives amongst the different chains. Results The gels produced bands that were not very distinct in sizes from one another. A gel can be seen in Figure 1. The standard used was PhiX HaeIII digest. From this a standard curve was made and using the slope DNA fragment sizes were calculated (Table 1). Three sequencing gels were done, however none produced a readable sequence. One gel can be seen in Figure 2. Because of an inability to determine a sequence, DNA from Cod, Pollock, and McDonalds fish were sent to Seqwright for sequencing. The sequences for Cod, Pollock, and McDonalds can be seen in Figure 3. This shows the bases that were different from the top genome. From this the % match was able to be determined. In Figure 3A the match between Pollock and McDonalds was 100% and between Cod and McDonalds there was a 92% match. In Figure 3B the match between Pollock and McDonalds was 98% and between Cod and McDonalds there was a 98% match as well. The sequences were then inserted into GenBank. All sequences came back as being from the mitochondrial genome of the fish used in this experiment. Figure 1. DNA electrophoresis gel. Gel contains two positive control marker lanes (one on each side) and the various fish samples. In the right most lane is Pollock, lane 2 Cod, lane 3 is McDonalds, lane 4 is Burger King, lane 5 is Long John Silver, and lane 6 is Captain D’s. Acknowledgements I would like to give a special thanks to Dr. Tschunko my advisor. Dr Brown my unofficial second advisor. The Marietta College Department of Biology and Environmental Science for funding this project and also providing the lab space for experimentation. I would also like to thank Dr. McShaffery, my capstone class advisor who helped teach me how to take pictures of gels under UV light. Finally, I would like to thank my fellow senior capstone students for helping me brainstorm. Figure 2. DNA sequencing gel. This is a small portion of a gel that produced some banding. Hypothesis Fast food fish sandwiches will contain Pollock. Materials and Methods Frozen Cod and Pollock were purchased from a local grocery store and were kept at -20oC. Fast food fish sandwiches came from McDonalds, Burger King, Long John Silver, and Captain D’s. Each sandwich was a plain sandwich with only the breading and the bun. The bun was discarded and the breading removed before the sample was collected. Fifty mg of fish meat was collected from the center of each sandwich. The samples under went cell lysis using Proteinase K and 10%SDS and incubated for a half hour in a 50oC water bath. After lysis the fish went through a series of purification steps. This included phenol, phenol:chloroform:isoamyl, and chloroform:isoamyl steps. Once extracted the DNA was purified and precipitated using absolute ethanol followed by 70%ethanol. The DNA pellet was resuspended in Tris-EDTA buffer. The DNA solution underwent PCR using the primers H1478:TGACTGCAGAGGGTGACGGGCGGTGTGT and L1091:AAAAAGCTTCAAACTGGGATTAGATACCCCACTAT. A References Barai BK, Nayak RR, Singhal RS, Kulkarni PR. 1992.Approaches to the Detection of Meat Adulteration. Trend in Food Science and Technology 3:69-72. Dooley JJ, Sage HD, Clarke MAL, Brown HM, Garrett SD. 2005. Fish Species Identification Using PCR-RFLP Analysis and Lab-on-a-Chip Capillary Electrophoresis: Application to Detect White Species Fish in Food Products and an Interlaboratory Study. Journal of Agricultural and Food Chemistry 53:3348-3357. Gil LA. 2007. PCR Methods for Fish and Fishery Products Authentication. Trend in Food Science and Technology 18:558-566. Pierron D, Opazo JC, Heiske M, Papper Z, Uddin M, Chand G, Wildman DE, Romero R, Goodman M, Grossman LI. 2011. Silencing, positive selection and parallel evolution: busy history of primate cytochomes c. PLoS ONE 6(10): 1-8. Rastogi G, Dharne MS, Walujkar S, Kumar A, Patole MS, Shouche YS. 2006. Species identification and authentication of tissues of animal origin using mitochondrial and nuclear markers. Meat Science 76: 666–674. B Table 1. Distance DNA traveled, in millimeters, for each fish sandwich and their corresponding molecular weights. Figure 3. Sequence of Fish Sandwiches. The dots show where there are similarities in the sequence and if there is a base instead of a dot that means instead of an A there is a G. N stands for any base. McDonalds is labeled A. (A.) This shows the sequence of Pollock and McDonalds compared to Cod for the primer L1091. (B.) This shows the sequence of Pollock and Cod compared to McDonalds for the primer H1478. Around base 50 two N’s were inserted into the sequence for McDonalds. Electrophoresis unit Electrophoresis unit Thermocycler