Download
1 / 32
370 likes | 632 Views
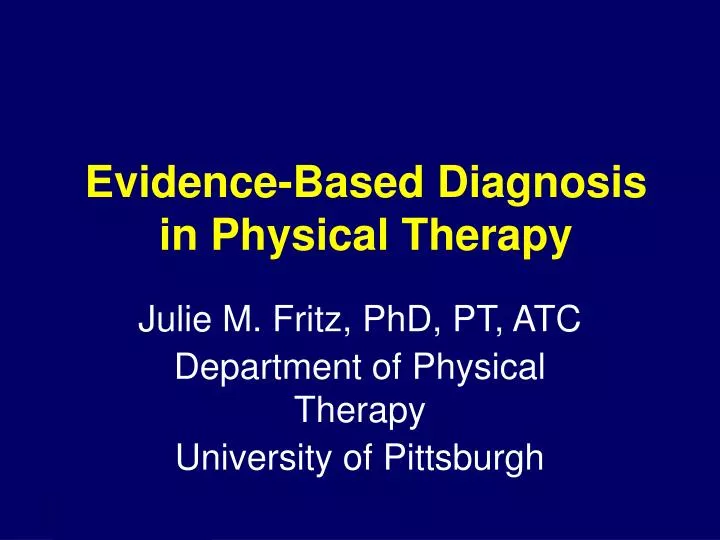
Evidence-Based Diagnosis in Physical Therapy. Julie M. Fritz, PhD, PT, ATC Department of Physical Therapy University of Pittsburgh. What is Diagnosis?. “The anatomic, biochemical, physiologic, or psychologic derangement”. Labeling Pathology. DIAGNOSIS . What is Diagnosis?.

E N D
Evidence-Based Diagnosis in Physical Therapy Julie M. Fritz, PhD, PT, ATC Department of Physical Therapy University of Pittsburgh
What is Diagnosis? “The anatomic, biochemical, physiologic, or psychologic derangement” Labeling Pathology DIAGNOSIS
What is Diagnosis? “Diagnosis is the term which names the primary dysfunction toward which the physical therapist directs treatment”(Sahrmann, 1989) Planning Treatment DIAGNOSIS
What is Diagnosis? • Medical Diagnosis: • Herniated Disc • CVA • Physical Therapy Diagnosis: • Right-sided radiculopathy centralizing with repeated extension • Left-sided hemiplegia - Brunnstrom Stage III: all movements in synergy with marked spasticity
Three Strategies of Clinical Diagnosis • Pattern recognition • Complete history and physical examination • Hypothetico-deductive strategy
Pattern Recognition • Instantaneous realization that the patient conforms to a previously learned pattern of disease • Usually reflexive, not reflective • Usually cannot be explained to others • Argued to be “learned” on patients and not “taught” in lecture halls
Complete History and Physical (Exhaustion) • The pain-staking search for (but paying no immediate attention to) all the facts about a patient. • Method of a novice • Impractical and inefficient
Hypothetico-Deductive Method • The formulation, from the earliest clues of a “short list” of potential diagnoses. • Subsequent tests are performed which will most likely reduce the length of the list. • Requires an understanding of probability (zebras versus horses).
Exhaustion empty the mind of all preconceived notions watch “nature in action” draw conclusions after all the facts are in Hypothesis-Driven bold hypotheses are proposed, then exposed to severe criticism requires understanding of confirmatory/discon-firmatory tests Exhaustive vs. Hypothesis-Driven Approach
Gathering Diagnostic Data for a Hypothesis-Driven Approach • Complete versus exhaustive data gathering • Must know what is good data • The importance of confirmatory and disconfirmatory data • Rarely is one test sufficient
Appraising the Literature Regarding Diagnostic Tests • The effectiveness of a hypothesis-driven approach hinges on appropriate selection and interpretation of diagnostic tests. • The clinician must be able to appraise the literature regarding diagnostic tests.
Appraising the Literature Regarding Diagnostic Tests Condition Present Condition Absent Test Positive Test Negative True Positive False Positive False Negative True Negative
Appraising the Literature Regarding Diagnostic Tests • Characteristics of Good Studies: • Independent Gold Standard • Operational Definitions • Representative Subjects
Condition Present Condition Absent Test Positive Test Negative True Positive A False Positive B True Negative D False Negative C SENSITIVITY A/(A+C) SPECIFICITY D/(B+D)
Sensitivity (True Positive Rate) • Proportion of patients with the condition who have a positive test result • Tests with high sensitivity have few false negatives, therefore a negative result rules out the condition. (SnNout)
Specificity (True Negative Rate) • Proportion of patients without the condition who have a negative test result • Tests with high specificity have few false positives, therefore a positive result rules in the condition. (SpPin)
Appraising the Literature Regarding Diagnostic Tests • Likelihood ratios combine the information contained in sensitivity and specificity values. • Permits comparisons among competing tests.
Appraising the Literature Regarding Diagnostic Tests • Positive Likelihood Ratio: Expresses the change in odds favoring the disorder given a positive test. • (Sensitivity/(1-Specificity)) • Negative Likelihood Ratio: Expresses the change in odds favoring the disorder given a negative test. • ((1-Sensitivity) /Specificity)
Appraising the Literature Regarding Diagnostic Tests • What characterizes a good test? • Large +LR (>5.0) • change the odds favoring the diagnosis given a + test • helpful for ruling in the condition. • Small -LR (<0.30) • reduce the odds favoring the diagnosis given a - test • . helpful for ruling out the condition.
Pre-Test Likelihood Post-Test Probability Ratio Probability X = = 50% (1:1) X 5.0 83% (5:1) = 50% (1:1) X 0.30 23% (.3:1)
An Example from the Literature • Rubenstein et al. The accuracy of the clinical examination of posterior cruciate ligament injuries. Am J Sports Med.1995. • Performed multiple clinical tests for PCL laxity in 39 patients (78 knees), 19 with a torn PCL. • gold standard = MRI.
Test Sens. Spec. + LR - LR__ Posterior Drawer 90% 99% 90.0 0.10 Posterior Sag Sign 79% 100% ~79.0 0.21 Qd. Active Drawer 54% 97% 18.0 0.47 Reverse Pvt Shift 26% 95% 5.2 0.78 KT-1000 86% 94% 14.3 0.15
An Example from the Literature • All tests had higher specificity than sensitivity, therefore each is better as a rule in test. • The posterior drawer test has a high +LR, and small -LR, making it an excellent diagnostic test
Your patient is a 23 year-old male s/p MVA whose knee hit the dashboard, you think he may have injured his PCL (25% probability). You perform a diagnostic test to r/o the PCL injury. The result is negative. Pre-Test Likelihood Post-Test Probability Ratio Probability X = Posterior Drawer Test: = 25% (.33:1) X 0.10 3% (.03:1) Reverse Pivot Shift Test: 25% (.33:1) = X 0.78 20% (.26:1)
Another Example • 69 patients with acute, work-related LBP • Waddell’s signs and symptoms assessed prior to treatment • Gold standard = return to work within four weeks
Test Sens. Spec. + LR - LR Signs (2+) 41% 79% 1.9 0.75 Symptoms (3+) 50% 81% 2.6 0.62 Signs+Symptoms (3+) 64% 62% 1.7 0.59
Another Example • None of the tests demonstrated good LRs • None of the tests would function well as a screening tool
You have a patient with acute, work-related LBP. You know approximately 20% of such patients go on to long-term problems. You use Waddell’s tests as a screen to see if this patient is at risk. The results are negative. Pre-Test Likelihood Post-Test Probability Ratio Probability X = Waddell’s Signs (<2): = 20% (.25:1) X 0.75 16% (.19:1) Waddell’s Signs+Symptoms (<3): 20% (.25:1) = X 0.59 13% (.15:1)
Integrating Diagnostic Information into Practice If Data Exists If Data Does Not Exist FIND IT!! COLLECT IT!!
Integrating Diagnostic Information into Practice • What You Need To Do: • Decide what you are diagnosing • List all possible variables • Decide on the “gold standard” • Measure Everyone !!
An Example You are in charge of screening residents of a long-term care facility for those who need therapy due to increased risk of falling. • What are you diagnosing - Risk of falling • What are the possible predictors? • What will be the gold standard of fall risk? • Follow-up everyone
THANK YOU Review this lecture