Download
1 / 63
650 likes | 942 Views
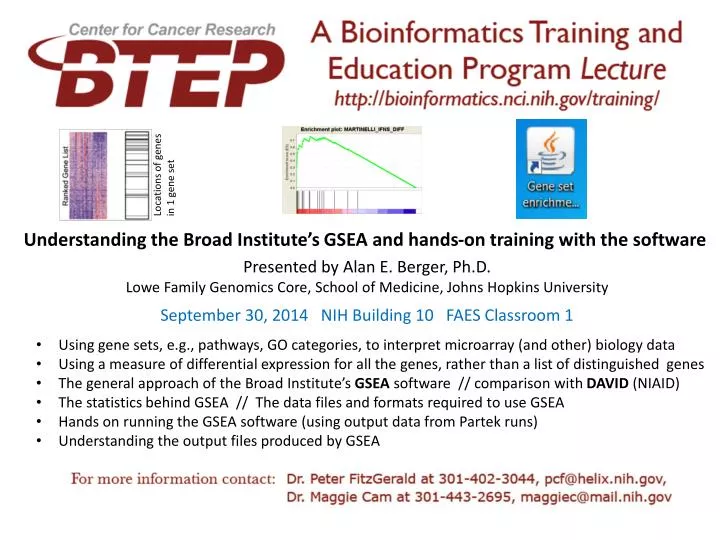
Locations of genes in 1 gene set. Understanding the Broad Institute’s GSEA and hands-on t raining with the software. Presented by Alan E. Berger, Ph.D. Lowe Family Genomics Core, School of Medicine, Johns Hopkins University. September 30, 2014 NIH Building 10 FAES Classroom 1.

E N D
Locations of genes in 1 gene set Understanding the Broad Institute’s GSEA and hands-on training with the software Presented by Alan E. Berger, Ph.D. Lowe Family Genomics Core, School of Medicine, Johns Hopkins University September 30, 2014 NIH Building 10 FAES Classroom 1 • Using gene sets, e.g., pathways, GO categories, to interpret microarray (and other) biology data • Using a measure of differential expression for all the genes, rather than a list of distinguished genes • The general approach of the Broad Institute’s GSEA software // comparison with DAVID (NIAID) • The statistics behind GSEA // The data files and formats required to use GSEA • Hands on running the GSEA software (using output data from Partek runs) • Understanding the output files produced by GSEA
The content of this set of slides is derived from several NIH-CIT tutorials on GSEA given by Aiguo Li, Ph.D., NIH-NCI and Alan Berger, Ph.D., in 2007 & 2008, and from slides prepared by Alan Berger and Maggie Cam, Ph.D., NIH-NCI for April and December 2013 NCI-BTEP classes on GSEA my contact information: Alan E. Berger aberger9@jhmi.edu 410-550-5089
Running GSEA 2. Provide expression data 1. Provide Gene sets 3. Choose parameters via GSEA interface 4. Decide if the GSEA output contains informative results Underlying figure from http://www.broadinstitute.org/gsea/index.jsp (April 2013)
Main Data Files for Input • Gene sets database files • GeneMatrix(filename.gmt) in local machine (download from the Broad MSigDB) • Expression Data files (expression values or differential expression levels) • Gene Cluster Text file: filename.gct(full expression data) • Ranked list file format: filename.rnk(condensed differential expression data) • ExpRESsion (with P and A calls) file: filename.res(a format for Affymetrix data) • Phenotype information files (categorical = specify the group for each sample) • Need a .cls file if using full expression data (.gct) • Categorical (e.g. tumor vs normal) class file format: filename.cls • Continuous (e.g. clinical data or a gene profile) file format: filename.cls Note the user must have done any desired normalization and transformation of expression data before submitting it to GSEA; GSEA suggests no transformation. see http://www.broadinstitute.org/cancer/software/gsea/wiki/index.php/Data_formats#Expression_Data_Formats
Information available from the Broad Institute GSEA documentation From http://www.broadinstitute.org/gsea/doc/GSEAUserGuideFrame.html April 2013
There are additional example datasets in the R-distribution of GSEA Subset of the web page http://www.broadinstitute.org/gsea/datasets.jsp April 2013
A gene sets file (.gmt) for GSEA Tab delimited text file but NO whitespace allowed after the last gene symbol in each row
Gene Set Description, could be just “na” Schematic of a .gmtGene Matrix Transposed Gene Sets file (Each Row is 1 Gene Set) (tab delimited text file) Gene Set Names, one per row, names must be unique Gene Identifiers, number of genes per gene set can vary, Case Sensitive (use CAP gene names in expression data files for gene sets from MSigDB) Gene Identifiers can be probe set IDs or gene symbols but MUST BE CONSISTENT WITH column 1 of the .gct file (the chip feature IDs). If using a .chip file within Java-GSEA then col 1 of the .gct and .chip files must correspond & the gene symbols here should be those used within the Gene Symbol column of the .chip file.
Figure from http://www.broadinstitute.org/gsea/msigdb/index.jsp April 2013
Figure from http://www.broadinstitute.org/gsea/msigdb/collections.jsp#C2 April 2013
Information available from the Broad Institute GSEA documentation From http://www.broadinstitute.org/gsea/doc/GSEAUserGuideFrame.html April 2013
Sample label or gene set permutation • Want at least 7 in each group to do sample label (phenotype) permutation • If insufficient samples use gene set permutation • If want a difference measure not in the GSEA menu use the GSEA Preranked option (and, perforce, gene set permutation) • Gene set permutation requires a more stringent FDR criterion (0.05,as opposed to 0.25 for sample label permutation)
.rnk file example (tab delimited text, may have 1 header line) Treated day 10 vs. Control culture day 10 Tscore; positive is up in Treated signed ranking metric: e.g., fold change, t-score, Gaussian Z value corresponding to (t-test p-value) / 2. No extra columns allowed.(In this example positive is up in Treated, negative values are up in the Control group.) Gene symbolsgene names must match the gene names used in the gene sets file, including case (generally use ALL CAPS), since lose information on non-matched genes; MSigDB uses human genome gene symbols Ideally, collapse duplicate gene symbols by picking the ranking metric value with the largest magnitude (e.g., {2., 3., -4.} -4.)
Exercise: Microarray Analysis using Partek and GSEA Samples: Glioma stem cells (GSC) were grown from tumor derived from a GBM patient. The GSC’s were cultured in control media or differentiation media (Retinoic Acid and serum) for 3 and 10 days, RNA was extracted and processed using Affymetrix U133Plus2 arrays. While the cells in control media continued to actively proliferate, ones in the differentiation media were found to slow down and differentiate into glial and/or neural lineage. The goal of the experiment is to find regulatory mechanisms driving differentiation of tumor stem cells for drug targets. Day 3 Day 10 Control Treated
NBE growth medium, optimal for propagation & nondiffer. of normal neural stem cells, produces GBM cells that behave more like the parent tumor Figure 8 above is from: Cancer Cell v9 May 2006. ‘‘NBE’’ conditions: serum-free Neurobasal media supplemented with basic FGF and EGF
Window to load required GSEA files: .gmt; {.rnkor .gct & .cls} (and if used -- .chip) after hit Load Data, get this window display Clicking here allows you to select a folder and then choose a file in that folder to load into GSEA. One by one load in the genes sets file and expression data file(s) for your run. Files loaded in recently can be selected (double click) from here For today’s class now load in: c2.cp.v4.0.plus.c5.all.v4.0.symbols_fromidlcat.gmt & GSEA_gene_list_2_Sept18_from_Xiaowen_Wang_zip_file.txt.rnk
After load the required data files, invoke GSEA either here (Tools -->Prerankedoption) or here (run using full expression dataset (requires gct and cls files)). Get this screen with the Prerankedoption which we will run now. Click on first field.
Since have loaded the gene sets file (.gmt), choose the local option
Lists all loaded gene sets files, choose one For today’s class will have loaded in c2.cp.v4.0.plus.c5.all.v4.0.symbols_fromidlcat.gmt which combines canonical pathway gene sets plus GO gene sets from MSigDB
First set # permutations to 100 so will run fast (normally use 1000) Next choose the ranked list file GSEA_gene_list_2_Sept18_from_Xiaowen_Wang_zip_file.txt.rnk (already loaded) Turn off (choose false) “collapse dataset …” in which case the “chip platform(s)” entry is irrelevant (leave blank).
GSEA parameters for run of Treated day 10 vs. Control day 10 with the Tscore as the ranking metric. Using canonical pathways gene sets plus GO gene sets 23161 unique gene symbols in this dataset use very descriptive folder/file names so can figure out what was run later on So will run in short amount of time For full run use 1000 permutations choose folder where output folder GSEA creates will be placed Pick a specific random number generator seed so can exactly reproduce the result 40 is a reasonable choice Use 13847 for today’s class Start GSEA Set CPU usage
When done, the status bar will (hopefully) have “success” in it (followed by some number) (and your computer may make a distinct noise when GSEA finishes a run)
From http://www.broadinstitute.org/gsea/doc/GSEAUserGuideFrame.html April 2013
gct & res Expression Data File Formats (tab delimited text files, displayed here using Excel): gene names must match the gene names used in the gene sets file, including case (generally use ALL CAPS) *.gct file: gives feature identifiers in column 1 and gene expression data *.res file: ExpRESsign with P, A, M calls and gene expression data (GSEA does not use the present / absent / marginal calls)
# probe sets or genes, i.e., # rows of expression data # samples expression levels (or logs), for a missing value leave cell empty Screen Image of P53.gct file (gene cluster text tab delimited file) NO Dashes (–)allowed in GSEA file names (Java) required, always the same sample identifiers, must be unique chip feature IDs can be a non- blank filler Expression levels Case Sensitive The entries in cell A3 (NAME) and in cell B3 (DESCRIPTION) (rotated here to fit) are required P53.gct tab delimited text file (displayed here in Excel) from the R-GSEA distribution from the Broad Institute: http://www.broad.mit.edu/gsea/index.html
Sample categorical .cls (class) file: Specify phenotype of each sample, e.g., tumor-type1, tumor-type2, normal; treated, control; same order from left to right as in the expression file (the .gct file) class names used by GSEA in output data Categorical class file: 3 lines, space delimited text file the 1 is required, does not change # samples in .gct file, # of phenotypes, 1 ASP ALA Symbols corresponding to the classes of the samples in the .gctfile; the 1st (D) <2nd (A)> distinct symbol in line 3 corresponds to the 1st <2nd> name in line 2 (ASP <ALA>) another class file example line 3 can be tab delimited 1 1 1 0 0 1 0 0 1 0 1 alternate acceptable line 3 for this class file
Example of a “Numeric” Class File Identifies this as a “numeric” .cls file arbitrary text used in some of the GSEA output file names vector V of numbers, one for each sample; genes will be ranked by a measure of their correlation with V A “numeric” .cls file, is of the form one would have in order to use the “Pearson correlation” gene ranking metric (for example, to rank the genes/gene sets by correlation with a clinical variable). If one had time series data, so, e.g., the samples give expression data of some system at a sequence of time points, the numeric values in line 3 (one for each sample, ordered as the samples are ordered in the .gct file) could be an expression pattern over time one was looking to have gene sets match. Or these values could be the expression levels of a gene one was looking to match, or a clinical variable, e.g., a measure of disease severity for each sample.
tab delimited text file (optionally used by Java GSEA to convert feature IDs to gene symbols) GSEA may optionally combine duplicate expr. values Illustration of .chip Description File column headers MUST be as displayed IDs & symbols arecase sensitive Use either these probe Set IDs in the gene set .gmt file or use these gene symbols IDs should corr. to col 1 of .gct file for more info see the GSEA documentation page UNIQUE ID | if none enter --- or null or na | if none enter --- or null or na see Zeeberg et al. BMC Bioinformatics 2004 for info on proper text file import into Excel Excel display of a modified section of: HG_U133A.chip. Chip files are available from the Broad Institute A .chip file can help matchup of gene symbols in data with those in the gene sets
Avoiding corruption of date like gene symbols when editing a tab delimited text file with Excel (define all columns containing gene symbols as text) Excel open file delimited tab delimited
Otherwise, may have to deal with fixing corrupted date like gene symbols (subset of a script)
Once a test run checks out, use, e.g., 1000 permutations; can check stability of NES & FDR results by varying #permutations, varying the initial random number generator seed (see next slide) Sample input choices for a test run for Desktop Java GSEA P53.gct, C2.gmt,P53.cls were previously loaded small # for test run P53.gct already has gene symbols in col 1, so no .chip file needed Click when have finished selecting parameters
Choices for measures of differential expression Sample input choices for Desktop GSEA: Advanced Fields this means using NES choose an explicit integer seed for random # generator so can easily reproduce results
A-B A + B signal2noise(g) Measures of Differential Expression Let the expression data consist of samples from two phenotypes A and B. For a given gene g: let A be the mean of the expression levels for g from the subset of samples having phenotype A & similarly for B;and likewise with standard deviations A and B. Then the signal2noise (GSEA default) measure of differential expression of g between A and B used as the gene ranking metric is: A number of other options are available from the Desktop GSEA, including tTest, log2_Ratio_of_Classes, Ratio_of_classes, and several measures of correlation for continuous phenotypes; see “Metrics for Ranking Genes” in http://www.broad.mit.edu/cancer/software/gsea/doc/GSEAUserGuideFrame.html
From http://www.broadinstitute.org/gsea/doc/GSEAUserGuideFrame.html April 2013
Information available from the Broad Institute GSEA documentation From http://www.broadinstitute.org/gsea/doc/GSEAUserGuideFrame.html April 2013
Information available from the Broad Institute GSEA documentation From http://www.broadinstitute.org/gsea/doc/GSEAUserGuideFrame.html April 2013
Information available from the Broad Institute GSEA documentation
Exercise: Microarray Analysis using Partek and GSEA Samples: Glioma stem cells (GSC) were grown from tumor derived from a GBM patient. The GSC’s were cultured in control media or differentiation media (Retinoic Acid and serum) for 3 and 10 days, RNA was extracted and processed using Affymetrix U133Plus2 arrays. While the cells in control media continued to actively proliferate, ones in the differentiation media were found to slow down and differentiate into glial and/or neural lineage. The goal of the experiment is to find regulatory mechanisms driving differentiation of tumor stem cells for drug targets. Day 3 Day 10 Control Treated
Hands-on sample runs of GSEA • examining the GSEA output • deciding if the output is statistically meaningful • harder: deciding if the output is biologically informative
GSEA output folder sorting files by date, most recent first, will get the files you want to look at on top
GSEA output folder from cell line A, day 10, Differentiated vs. Control Tscore as metric Using canonical pathways gene sets plus GO gene sets sorting files by date, most recent first, will get the files you want to look at on top GSEA adds the analysis type and a unique timestamp to the user provided folder name
The .xls (Excel) files in the GSEA output folder are actually tab delimited text files, so will get this warning message when open one - just click on yes
GSEA output from cell line A, Treated day 10 vs. Control day 10 Tscore as metric Using canonical pathways gene sets plus GO gene sets Gene sets up in Control day 10 vs. differentiated (Treated) day 10 In the corresponding .html file, clicking on the gene set name, or on “details” gets additional information
GSEA output from cell line A, Treated day 10 vs. Control day 10 Tscore as metric Using canonical pathways gene sets plus GO gene sets Gene sets up in differentiated (Treated) day 10 vs. Control day 10
Sample label or gene set permutation good FDRs • Gene set permutation (e.g., Preranked option) requires a more stringent FDR criterion (GSEA FDR q-val≤ 0.05,as opposed to 0.25 for sample label permutation with full dataset)
Information on the genes in the Leading Edge of the DNA Replication gene set (header row image was pasted in) 23161 unique gene symbols in this dataset so 23117 is pretty close to the most negative end of the ranked list of genes
GSEA output from cell line A, Treated day 10 vs. Control day 10 Tscore as metric Using canonical pathways gene sets plus GO gene sets Gene sets up in differentiated (Treated) day 10 vs. Control day 10