Download
1 / 26
270 likes | 282 Views
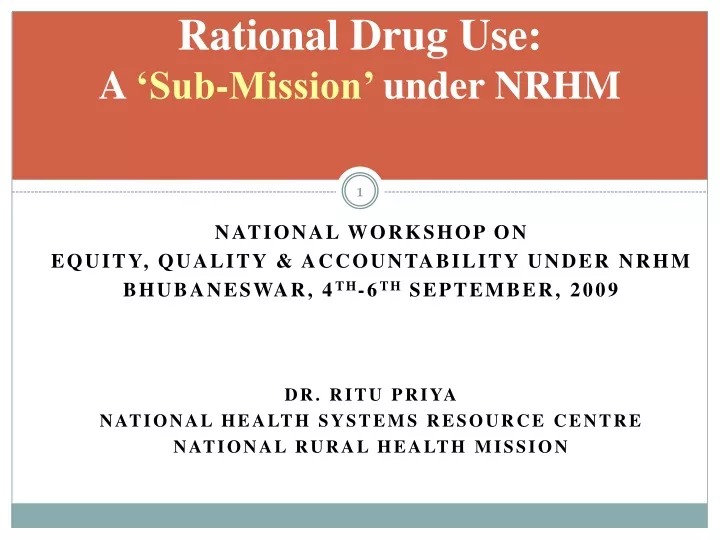
Rational Drug Use: A ‘Sub-Mission’ under NRHM. National Workshop on Equity, Quality & Accountability under NRHM Bhubaneswar, 4 th -6 th September, 2009 Dr. Ritu Priya National Health Systems Resource Centre National Rural Health Mission. THE CONTEXT OF NRHM

E N D
Rational Drug Use: A ‘Sub-Mission’ under NRHM National Workshop on Equity, Quality & Accountability under NRHM Bhubaneswar, 4th-6th September, 2009 Dr. Ritu Priya National Health Systems Resource Centre National Rural Health Mission
THE CONTEXT OF NRHM MAJOR CAUSE FOR RURAL INDEBTEDNESS = MEDICAL EXPENDITURE 70% OF THE MEDICAL EXPENDITURE = COST OF MEDICINES (NSSO 60th rd.) MORTALITY RATES DECLINING SLOWLY, 2003 to 2007 (SRS) IMR = 60 to 55 /1000 live births CDR= 8 to 7.4 / 1000 population
GROWTH RATE OF THE NATIONAL ECONOMY = 6-9% DECLINE OF POOREST AS %age OF HOUSEHOLDS = 50%(NSSO, 1999 & 2004; 364 & 176/1000 hh.) HOUSEHOLD EXPENDITURES EXPENDITURE ON FOOD :54 to 52% of total EXPENDITURE ON Medical: 3.5 to 7.5% of total EXPENDITURE ON FOOD : MEDICAL SERVICES= decreasing (7.4:1 decreased to 6.3:1; NSSO) NUTRITIONAL DEFICIENCIES PERSIST Households not getting food to provide adequate cal./proteins= 70% Low Birth Weight babies= 30% Moderate & severe undernutrition (0-5yrs.)=58%
Despite improvements in the two primary determinants of health: I. SOCIO-ECONOMIC STATUS High economic growth & Decrease in proportion of BPL II. HEALTH SERVICES AVAILABILITY & ACCESS Strengthening of Public Health infrastructure & Enhanced utilisation of health care WHY IS IMR and CDR DECLINE SO SLOW?
Probable causes of Improvements in Health not Commensurate with those in Economy & Health services: • Low purchasing power & living/working • conditions of over 50% of the population • Increasing economic and social disparities • Increasing incomes going to medical (and • other non-food) expenditures rather than to • improving diets • CAN HEALTH BE GAINED WITH MEDICINES INSTEAD OF FOOD??
IF WE ACCEPT THAT THIS IS NOT ACCEPTABLE, • THAT BOTH ARE NECESSARY, THEN: • Household expenditure on Medicines needs • to be cut. • Incomes have to allow increase in food expenditure & Social values have to promote dietary intakes for women and children. • So that: • Health can improve.
Worldwide: • >50% of all medicines are prescribed/dispensed/sold inappropriately • 50% of patients fail to take medicines correctly. • Iatrogenic diseases are rapidly increasing, one-fourth of hospital patients in the USA suffering from iatrogenic problems • In India: • 300-400 medicines are essential, but • 70,000 formulations in the market!!! • 4 out of 5 vitamin preparations are irrational • 2 out of 5 contain are non-essentials • 80% cough & cold remedies irrational
Items banned risks > benefits Reference: MIMS India, October 2002, GOI weed-out notifications
POSSIBLE MEASURES • PROVISION OF RATIONAL & FREE MEDICINES BY THE PUBLIC HEALTH SERVICES TO: • BPL PATIENTS • ALL PATIENTS • THERE IS VARIATION ACROSS STATES, • MOST NOT GIVING ADEQUATE TO ALL
IMPLICATIONS OF FREE TO ALL THREATS/BARRIERS BENEFITS • There is the moral hazard of grab and waste • The costs are too high to the service system • Cuts the Provider-Pharma nexus • Cuts costs of medical care to society as a whole
Corrective Measures THREATS/BARRIERS CORRECTIVE MEASURES • There is the moral hazard of grab and waste • The costs are too high to the service system • Promote rational drug use prescribing • Buy Generic drugs • Negotiate lower prices with the benefit of bulk purchase. • Regulate drug prices
Therefore to: Decrease side-effects Decrease costs Make healthcare more effective. Adopt: RATIONAL USE OF MEDICINES Procurement and Prescribing of Generics
WHAT IS RATIONAL DRUG USE? • Patients receiving medications: • appropriate to their clinical needs • in the required dose • for an adequate period of time • at the lowest cost to them and their community. • (WHO, 1985) • Irrational or non-rational use is the use of medicines in a way that is not compliant with rational use as defined above.
IRRATIONAL USE OF MEDICINES • Inappropriate Medication • Too many medicines prescribed perpatient • (poly- pharmacy) • Cross reacting drugs • Inappropriate Prescription of • antimicrobialsfor non-bacterial infections • Over-prescription of Inj. when oral drugs • effective
B. Poor Communication • Non-drug aspects not communicated • Poor communication of information • regarding drugs to patient. • Inappropriate self-medication
Tools to Facilitate Rational Prescribing Practices Essential Drug List Drug Formulary Standard Treatment Guidelines Prescription Audits
The Essential Drug List (EDL): • satisfies priority health care needs of the • population • with due regard to disease prevalence • evidence on efficacy and safety, and • comparative cost-effectiveness. • The Essential Drug List (EDL): • Is meant to treat ALL common health problems • It is not only a list of ‘life-saving’ medicines
DRUG FORMULARY & STANDARD TREAMENT GUIDELINES • A Drug Formulary: • lists each drug • its indications • doses and formulations • its side effects • contraindications and • interactions with other drugs.
STANDARD TREATMENT GUIDELINES • List the preferred drug and nondrug treatments (including reassurance) • Include instructions /messages for patients • For each drug include the name, dosage form, strength, average dose (pediatric and adult), number of doses per day, and number of days of treatment.
Standard treatment guidelines are necessary: • fortherapeutically effective and economically efficient use of drugs and diagnostics • to decide about drug & equipment supplies • to assist with adherence to the prescribed treatment.
COMPONENTS OF ACTION FOR RDU I. Drug & Equipmet Procurement and Distribution System developed on principles of: Local Need; Systems for no stock out; Cost and Quality considerations; Transparency in procurement and distribution II. Drug and Therapeutics Committee to develop & regularly revise the EDL & Formulary III. Development of Standard Treatment Guidelines IV. ORIENTING Providers & Monitoring through regular Prescription Audits V. IEC/BCC/Social Marketing for Public Education
RELEVANCE OF RDU FOR NRHM For Meeting ITS GOALS Incremental Additions to the architectural correction • Reducing IMR TO 30/1000 • Increasing Utilization of public health facilities from current level of OPD <20% to >75% • Increasing health expenditure by Govt. as a % of GDP from the existing 0.9% to 2.0% • Infra-structure being strengthened • Personnel being added • NOW QUALITY OF FUNCTIONING, PROCESSES, & CLINICAL CONTENT MUST BE THE FOCUS • KAP OF PROVIDERS IS KEY
THUS, IN THE HEALTH SYSTEM, RATIONAL DRUG USE IS FOR Equity Quality Accountability SO SHOULD THERE BE A RDU Sub-Mission Under the NRHM????
THE ISSUES FOR AN RDU Sub-Mission • A concerted effort on all three fronts must be launched simultaneously: • Procurement, Prescribing & Public information. • 2. Do we provide free medicines to BPL only or to ALL? • 3. Where will the funds come from? • 4. Rational & Generics only in public services? What about the private sector, & its costs?
MALNUTRITION [Govt. of Rajasthan, BPL Census 2002] BPL APL • % OF TOTAL POP.= 22.7 • % OF BPL NOT GETTING 2 MEALS THROUGHTOUT THE YEAR= 88 • % OF TOTAL POP. NOT GETTING ENOUGH FOOD=20 • % OF TOTAL POP.= 77.3 • % OF APL NOT GETTING 2 MEALS THROUGHOUT THE YEAR= 33 • % OF TOTAL POP. NOT GETTING ENOUGH FOOD=25.5
Looking Forward To Optimising Opportunities of the NRHM THANK YOU