Download
1 / 22
400 likes | 1.09k Views
Distribution Measures This module covers the concepts of numeric distribution, all commodity volume (ACV), product category volume (PCV) and out-of-stocks. Author: Paul Farris Marketing Metrics Reference: Chapter 6. Measures of Distribution. Measures of Distribution.

E N D
Distribution Measures This module covers the concepts of numeric distribution, all commodity volume (ACV), product category volume (PCV) and out-of-stocks. Author: Paul Farris Marketing Metrics Reference: Chapter 6
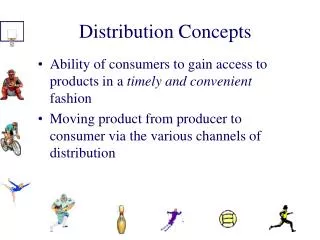
Measures of Distribution Measures of Distribution • Measures of distribution serve to understand the sales dynamics in the retail channel and are useful in making appropriate decisions regarding expansion and growth strategies. • This overview explores three measures of distribution coverage: • Numeric Distribution • All Commodity Volume (ACV) • Product Category Volume, including the impact of out-of-stock on net PCV. Definition Stock Keeping Unit (SKU) is a unique identifier for each distinct product or service that can be purchased. You will see SKU referenced throughout this presentation. A brand will typically include many unique SKUs.
Numeric Distribution Numeric Distribution Definition Numeric Distribution: a percentage measure of stores that stock a given SKU or brand compared to the universe of stores in the relevant market. Or = (# stores that stock a brand or SKU) / (total stores in relevant market) Insight The number of physical stores involved in your supply chain has implications for delivery systems, cost of servicing, and market share.
Calculating Numeric Distribution Calculating Numeric Distribution Sample application: The numeric distribution of Madre’s brand tortillas is calculated as follows: Numeric distribution = (stores carrying Madre’s) / (total # of stores) Numeric distribution = (3) / (4) = 75% What is the numeric distribution of the 12 ct pack of Padre’s Tortillas? See next slide for answer . . .
Calculating Numeric Distribution (Solution) Calculating Numeric Distribution (solution) 2 stores Answer: The numeric distribution of the 12 ct pack of Padre’s brand tortillas = (stores carrying 12 ct Padre’s) / (total # of stores) Numeric distribution = (2) / (4) = 50%
All Commodity Volume • Distribution All Commodity Volume Definition All Commodity Volume: a percentage measure of the total dollar volume of retail sales of stores stocking an SKU or brand versus total dollar volume sales in all categories ACV is a better measure of the total traffic that goes through the stores that stock your product or brand than numeric distribution. However, it does not say anything directly about how well those stores merchandise and compete in the relevant product category.
Calculating % ACV • Distribution Numeric Calculating % ACV Sample application: The % ACV of Madre’s brand tortillas is calculated as follows: % ACV = (total sales of stores carrying Madre’s) / (total sales all stores) % ACV = ($100k + $75k + $50k) / ($100k + $75k + $50k + $40k) = 84.9% What is the % ACV of the 12 ct pack of Padre’s Tortillas? See next slide for answer . . .
Calculating % ACV (Solution) • Distribution Numeric Calculating % ACV (solution) these stores Answer: The % ACV of the 12ct pack of Padre’s brand tortillas is: % ACV = (total sales of stores carrying 12ct Padre’s) / (total sales all stores) % ACV = ($100k + $40k) / ($100k + $75k + $50k + $40k) = 52.8%
Product Category Volume • Distribution Product Category Volume Definition Product Category Volume represents the share of category sales by the stores that stock your brand. Note that the term, Product Category Volume, is not an industry standard. Insight When PCV is available, it is a better indicator of where consumers look to buy a particular category of product or service. Often marketers use ACV as a rough surrogate for PCV, but the risk of using ACV alone is over-emphasizing high traffic stores where a product category may be available, but not purchased at a rate indicative of the store’s overall volume.
Calculating % PCV • Distribution Numeric Calculating % PCV Sample application: The % PCV of Madre’s brand tortillas is: % PCV = (tortilla sales of stores carrying Madre’s) / (tortilla sales all stores) % PCV = ($1000 + $500 + $300) / ($1000 + $500 + $300 + $400) = 81.8% What is the % PCV of the 12 ct pack of Padre’s Tortillas? See next slide for answer . . .
Calculating % PCV (Solution) • Distribution Numeric Calculating % PCV (solution) these stores Answer: The % PCV of the 12ct pack of Padre’s brand tortillas would be: % PCV = (tortilla sales of stores carrying Padre’s 12ct) / (tortilla sales all stores) % PCV = ($1000 + $400) / ($1000 + $500 + $300 + $400) = 63.6%
Store versus Brand or SKU Measures Store versus Brand Measures We also might want to apply these metrics to particular chains. For example, numeric distribution of a chain would equal the number of stores in a particular chain divided the total number of stores in the market. Marketers often refer to a grocery chain’s ACV. This may be either a dollar number (the chain’s total sales of all categories in the relevant geographic market) or a percentage number (their share of those dollar sales). Finally, marketers sometimes refer to a chain’s share of a specific category’s sales in a market. This is equivalent to the chain’s % PCV, as defined earlier. Insight: Comparing the ratio of a specific chain’s % PCV with its % ACV provides insight into whether the chain is performing above or below average in selling a particular category as compared to other stores or chains in the relevant market. If the ratio of (PCV / ACV) > 1 that means that chain is performing comparatively better in the particular product category in question than the other chains.
Working with Chains . . . (problem 1) Working with Chains . . . (problem 1) What is the numeric distribution for Chain 1 of stores carrying tortillas? See next slide for answer . . .
25 stores • Working with Chains . . . (problem 1 solution) Working with Chains…(problem 1 solution) Answer: The numeric distribution for chain 1 is caluclated as follows: Numeric distribution = (chain 1 # of stores) / (total # of stores carrying tortillas) Numeric distribution = (25) / (25 + 12 + 10 + 20) = 37.3%
Working with Chains . . . (problem 2) Working with Chains . . . (problem 2) What is the % ACV for Chain 1? See next slide for answer . . .
Working with Chains . . . (problem 2 solution) Working with Chains . . . (problem 2 solution) Answer: The % ACV of Chain 1 is calculated as: % ACV = (Chain 1 total sales) / (total sales all chains) % ACV = ($1,000,000) / ($1,000,000 + $750,000 + $500,000 + $300,000) % ACV = 39.2%
Working with Chains . . . (problem 3) Working with Chains . . . (problem 3) What is the % PCV of Chain 1? See next slide for answer . . .
Working with Chains . . . (problem 3 solution) Working with Chains . . . (problem 3 solution) Answer: The % PCV of Chain 1 is calculated as: % PCV = (Chain 1 tortilla sales) / (total tortilla sales all chains) % PCV = ($10,000) / ($10,000 + $5,000 + $3,000 + $4,000) = 45.45%
Working with Chains . . . (continued) Working with Chains . . . (continued) Insight: Comparing the ratio of a specific chain’s % PCV with its % ACV provides insights into whether the chain is performing above or below average in selling a particular category as compared to the store or chain’s overall sales. % PCV Chain 1 = 45.45% % ACV Chain 1= 39.2% Chain 1 ratio of PCV to ACV = (45.45%) / (39.2%) = 1.16 The ratio is greater than 1. Thus, Chain 1 is performing comparatively better in the particular product category in question than the other chains.
Out-of-Stocks Out-of-Stocks • Being “listed” by a chain means that the headquarters buyer has “authorized” distribution of the brand/SKU at the store level. • For various reasons, being listed does not always ensure presence on the shelf. Local managers may not approve distribution or the product may be distributed, but “out-of-stock.” • Out-of-stocks are often expressed as a percentage. Be careful to note whether the percentage is numeric, ACV, PCV, or percentage of distributing stores for a given chain.
Calculating PCV Net of Out-of-Stocks Calculating PCV Net of Out-of-Stocks Definition PCV Net of Out-of-Stocks: the sum of the % PCV of each chain multiplied by (1-% OOS) What is the PCV Net of Out-of-Stocks of Madre’s Tortillas? See next slide for answer . . .
Calculating PCV Net of Out-of-Stocks (cont.) Calculating PCV Net of Out-of-Stocks (continued) Answer: % PCV Chain 1 = (($10,000) / ($22,000)) x (1 - .05) = 43.2% % PCV Chain 2 = (($5,000) / ($22,000)) x (1 - .10) = 20.5% % PCV Chain 3 = (($3000) / ($22,000)) x (1 - .12) = 12.0% PCV Net of OOS of Madre’s Tortilla’s = 43.2% + 20.5% + 12% = 75.7%