Download
1 / 13
130 likes | 319 Views
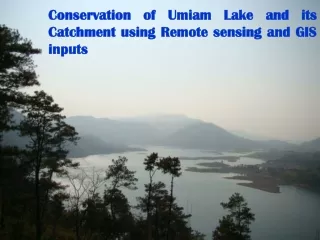
Lake Ravn catchment. Irene Paulsen, Skanderborg municipality and Kjartan Einarson, agricultural advisor. Lake Ravn Catchment Total area 5500 ha, approx. 4100 ha farmland Project area marked with red. Farmland in the projectarea app. 520 ha ~ ¼ of the total farmland in the catchment.

E N D
Lake Ravn catchment Irene Paulsen, Skanderborg municipality and Kjartan Einarson, agricultural advisor
Lake Ravn CatchmentTotal area 5500 ha, approx. 4100 ha farmlandProject area marked with red Farmland in the projectarea app. 520 ha ~ ¼ of the total farmland in the catchment
The goal for Lake Ravn 1993 -2002: Average load of 1700 kg P/year The modeling indicated a need for a 50 % reduction of the average phosphorus load during the years in which the modeling was done to reach ”good ecological status”. Goal : 50 % of 1700 kg/year = 850 kg P/year max. 2001-2005: Average load approx. 1300 kg P/year 300 kg P reduced by better waste water purification 150 kg P/year to be reduced from the farmland
Goal for Lake Ravn Present P-load 1300 Averagetotal load -300 Better purification af wastewater -600 Esitmated natural load/farmland -200 from either natural or farmland 150 Surplus =loss from farmland
Integrated advisory servicebefore visiting the farmer Enviromental accounting (N and P account) DIS – map GAP – Good Agricultural Practice Manual a, list of possible methods to reduce P-surplus Results of soil-mapping P-index Side 5·15-08-2014·
Soiltype mapping Eksempel på kort
Bek P-index map Low index Medium index High index
Integrated advisory servicewhen visiting the farmer Pin-point risk-areas (steep fields, streams close to the fields, use of the fields; history and now) Analyse methods in the GAP-manual – what could be used on this farm
Summary of integrated advisory visits The reduction in potential loss of phosphorus, achieved/obtained at the integrated advisory visits was not enough to fulfill the goal in the catchment area. Achieved in the short term: 3 kg P/year in the project area (*4=12) Achieved in the long term: 17 kg P/year in the project area (*4 =68) Goal: 150 kg P/year can not be reached, even on the long term
Catchment - solution The idea: Water from streams in the catchment run through a lake, where phosphorus can settle, before continuing to Lake Ravn. To day: The area is flooded in the wintertime, animals feed on the grass in the summertime The are some valuable meadows in the area
Problems in the catchment solution: More than one owner, with different interests Other than the owners gain from the effect – compensation ? Part of the potential lake-area is used in agricultural farming Part of the meadow-area is home for rare plant-species Catchment - solution
Alternative to catchment solution Small sedimentation basins, in connection with drainages from fields with high P-index, before outlet to the stream. Experiment will be established in the spring 2009 and the first results in the spring 2010. This solution is easier, because it only involves one landowner.