Download
1 / 147
1.47k likes | 1.59k Views
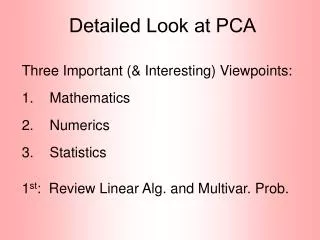
Detailed Look at PCA. Three Important (& Interesting) Viewpoints: Mathematics Numerics Statistics 1 st : Review Linear A lg. and M ultivar . Prob. Review of Linear Algebra (Cont.). Better View of Relationship: Singular Value Dec. Eigenvalue Dec.

E N D
Detailed Look at PCA • Three Important (& Interesting) Viewpoints: • Mathematics • Numerics • Statistics • 1st: Review Linear Alg. and Multivar. Prob.
Review of Linear Algebra (Cont.) • Better View of Relationship: • Singular Value Dec. Eigenvalue Dec. • Start with data matrix: • With SVD: • Create square, symmetric matrix: • Note that: • Gives Eigenanalysis,
Review of Multivariate Probability Given a Random Vector, A Center of the Distribution is the Mean Vector, Note: Component-Wise Calc’n (Euclidean)
Review of Multivariate Probability Given a Random Vector, A Measure of Spread is the Covariance Matrix:
Review of Multivar. Prob. (Cont.) Outer ProductRepresentation: , Where:
PCA as an Optimization Problem Find “Direction of Greatest Variability”:
PCA as an Optimization Problem Find “Direction of Greatest Variability”:
PCA as Optimization (Cont.) Now since is an Orthonormal Basis Matrix, and So the Rotation Gives a Distribution of the Energy of Over the Eigen-Directions And is Max’d (Over ), by Putting all Energy in the “Largest Direction”, i.e. , Where “Eigenvalues are Ordered”,
PCA as Optimization (Cont.) • Notes: • Solution is Unique when • Else have Sol’ns in Subsp. Gen’d by 1st s • Projecting onto Subspace to , • Gives as Next Direction • Continue Through ,…, • Replace by to get Theoretical PCA • Estimated by the Empirical Version
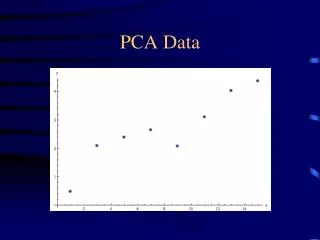
Connect Math to Graphics 2-d Toy Example Descriptor Space Object Space Data Points (Curves) are columns of data matrix, X
Connect Math to Graphics (Cont.) 2-d Toy Example Descriptor Space Object Space PC1 Direction = η = Eigenvector (w/ biggest λ)
Connect Math to Graphics (Cont.) 2-d Toy Example Descriptor Space Object Space Centered Data PC1 ProjectionResidual Best 1-d Approx’s of Data
Connect Math to Graphics (Cont.) 2-d Toy Example Descriptor Space Object Space Centered Data PC2 ProjectionResidual Worst 1-d Approx’s of Data
PCA Redistribution of Energy Convenient Summary of Amount of Structure: Total Sum of Squares Physical Interpetation: Total Energy in Data Insight comes from decomposition Statistical Terminology: ANalysis Of VAriance (ANOVA)
PCA Redist’n of Energy (Cont.) • Have already studied this decomposition (recall curve e.g.) • Variation (SS) due to Mean (% of total) • Variation (SS) of Mean Residuals (% of total)
PCA Redist’n of Energy (Cont.) • Eigenvalues Provide Atoms of SS Decompos’n • Useful Plots are: • Power Spectrum: vs. • log Power Spectrum: vs. • Cumulative Power Spectrum: vs. • Note PCA Gives SS’s for Free (As Eigenval’s), • But Watch Factors of
PCA Redist’n of Energy (Cont.) • Note, have already considered some of these Useful Plots: • Power Spectrum • Cumulative Power Spectrum
Connect Math to Graphics (Cont.) 2-d Toy Example Descriptor Space Object Space Revisit SS Decomposition for PC1
Connect Math to Graphics (Cont.) 2-d Toy Example Descriptor Space Object Space Revisit SS Decomposition for PC1: PC1 has “most of var’n” = 93% Reflected by good approximation in Desc’r Space
Connect Math to Graphics (Cont.) 2-d Toy Example Descriptor Space Object Space Revisit SS Decomposition for PC1: PC2 has “only a little var’n” = 7% Reflected by poor approximation in Desc’or Space
Different Views of PCA • Solves several optimization problems: • Direction to maximize SS of 1-d proj’d data
Different Views of PCA 2-d Toy Example Descriptor Space Object Space • Max SS of Projected Data • Min SS of Residuals • Best Fit Line
Different Views of PCA • Solves several optimization problems: • Direction to maximize SS of 1-d proj’d data • Direction to minimize SS of residuals
Different Views of PCA 2-d Toy Example Feature Space Object Space • Max SS of Projected Data • Min SS of Residuals • Best Fit Line
Different Views of PCA • Solves several optimization problems: • Direction to maximize SS of 1-d proj’d data • Direction to minimize SS of residuals • (same, by Pythagorean Theorem)
Different Views of PCA • Solves several optimization problems: • Direction to maximize SS of 1-d proj’d data • Direction to minimize SS of residuals • (same, by Pythagorean Theorem) • “Best fit line” to data in “orthogonal sense” • (vs. regression of Y on X = vertical sense • & regression of X on Y = horizontal sense)
Different Views of PCA • Toy Example Comparison of Fit Lines: • PC1 • Regression of Y on X • Regression of X on Y
Different Views of PCA Normal Data ρ = 0.3
Different Views of PCA Projected Residuals
Different Views of PCA Vertical Residuals (X predicts Y)
Different Views of PCA Horizontal Residuals (Y predicts X)
Different Views of PCA Projected Residuals (Balanced Treatment)
Different Views of PCA • Toy Example Comparison of Fit Lines: • PC1 • Regression of Y on X • Regression of X on Y • Note: Big Difference Prediction Matters
Different Views of PCA • Solves several optimization problems: • Direction to maximize SS of 1-d proj’d data • Direction to minimize SS of residuals • (same, by Pythagorean Theorem) • “Best fit line” to data in “orthogonal sense” • (vs. regression of Y on X = vertical sense • & regression of X on Y = horizontal sense) • Use one that makes sense…
PCA Data Representation Idea: Expand Data Matrix in Terms of Inner Prod’ts & Eigenvectors
PCA Data Representation Idea: Expand Data Matrix in Terms of Inner Prod’ts & Eigenvectors Recall Notation: (Mean Centered Data)
PCA Data Representation Idea: Expand Data Matrix in Terms of Inner Prod’ts & Eigenvectors Recall Notation: Spectral Representation (centered data):
PCA Data Represent’n (Cont.) Now Using:
PCA Data Represent’n (Cont.) Now Using: Spectral Representation (Raw Data):
PCA Data Represent’n (Cont.) • Now Using: • Spectral Representation (Raw Data): • Where: • Entries of are Loadings • Entries of are Scores
PCA Data Represent’n (Cont.) Can Focus on Individual Data Vectors: (Part of Above Full Matrix Rep’n)
PCA Data Represent’n (Cont.) Can Focus on Individual Data Vectors: (Part of Above Full Matrix Rep’n) Terminology: are Called “PCs” and are also Called Scores
PCA Data Represent’n (Cont.) • More Terminology: • Scores, are Coefficients in Spectral Representation:
PCA Data Represent’n (Cont.) • More Terminology: • Scores, are Coefficients in Spectral Representation: • Loadings are Entries of Eigenvectors:
PCA Data Represent’n (Cont.) Reduced Rank Representation:
PCA Data Represent’n (Cont.) • Reduced Rank Representation: • Reconstruct Using Only Terms • (Assuming Decreasing Eigenvalues)
PCA Data Represent’n (Cont.) • Reduced Rank Representation: • Reconstruct Using Only Terms • (Assuming Decreasing Eigenvalues) • Gives: Rank Approximation of Data
PCA Data Represent’n (Cont.) • Reduced Rank Representation: • Reconstruct Using Only Terms • (Assuming Decreasing Eigenvalues) • Gives: Rank Approximation of Data • Key to PCA Dimension Reduction
PCA Data Represent’n (Cont.) • Reduced Rank Representation: • Reconstruct Using Only Terms • (Assuming Decreasing Eigenvalues) • Gives: Rank Approximation of Data • Key to PCA Dimension Reduction • And PCA for Data Compression (~ .jpeg)
PCA Data Represent’n (Cont.) Choice of in Reduced Rank Represent’n: