Download
1 / 31
310 likes | 497 Views
Vital Statistics: Census & Fertility. Professor Michael Clarke Dept of Epidemiology & Public Health. Uses of Epidemiology J.N. Morris Size of Problem Historical Perspective Aetiological Factors Planning and Evaluating Services. Objectives. Following the session, you should be able to:

E N D
Vital Statistics: Census & Fertility Professor Michael Clarke Dept of Epidemiology & Public Health
Uses of Epidemiology J.N. Morris • Size of Problem • Historical Perspective • Aetiological Factors • Planning and Evaluating Services
Objectives Following the session, you should be able to: • Outline and distinguish between the processes of birth registration and notification • Discuss the main determinants of fertility in the UK over the last 30 years • Define and illustrate the use of: • The crude birth rate • The general fertility rate • Age-specific fertility rates
Objectives • Outline the changes in fertility and mortality that have occurred in England during the last one hundred years • Describe the uses and limitations of population estimates and projections
Objectives • Describe the characteristics of the national census and outline the history of census taking in England • List the major items of information collected in the English 1991 census and the relevance of these data to health and social services • Illustrate how demographic characteristics of populations determine health and social service priorities
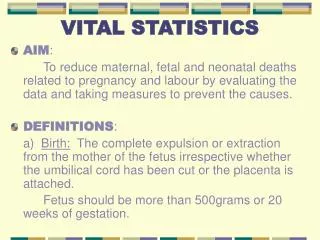
Birth Statistics Registration Notification
Birth Statistics • Registration of Births (1837) Birth to be registered within six weeks with the Registrar of Births, Marriages and Deaths, by an informant (usually the parent).
Birth Statistics • Notifications of Births (1907) Within 36 hours by the attendant at the delivery, to the District Medical Officer – so community services (health visitors) can be mobilised.
Birth Rate • Live Births / 1000 population
Fertility Rate • Live Births / 1000 female population aged 15 - 44
Total Period Fertility Rate “ The average number of children that would be born to a hypothetical woman if she experienced the age specific fertility rates of a given year (or period) throughout her child bearing life.” Ugh!!
E.g. England & Wales - 1992 Women aged 15 (301,600) have 1,090 births .0036 aged 16 ……. have 3,800 .0126 aged 17 ……. have 8,882 .0294 aged 28 .1205 aged 44 Total Period Fertility Rate 1.7 N.B. There were 222 live births to women aged less than 15 yrs in 1992 in Wales
Fertility & Abortions in England and Wales & Selected Health Authorities - 1985 TPFR = Total Period Fertility Rate TPAR = Total Period Abortion Rate TPCR = Total Period Conception Rate
Determinants of Fertility • Fecundity – physiological ability to reproduce. (fertility - realisation of the potential) Increase in sterilisation & Hysterectomies • Sexual activity Economic climate
Contraception – Current use for women aged 16-49 in Great Britain, 1993 * Includes the cap, safe period, spermicides and injection
Trends in contraceptive use 1970-1983 1970 Family planning: changes and effects (England & Wales), M Bone 1976 Family formation survey 1976 (GB), K Dunnell 1983 General Household Survey 1983 (GB)
Determinants of Fertility • Abortion - 179,590 England and Wales 1997
Population Estimates & Projections • Estimates Apply what is known from deaths, births, migration – to the present. • Projections Future orientated given certain assumptions.
Population Estimates – E.g. Leicestershire 1981 858.8 Census Base 1989 Migration + 9.4 excess inflow over outflow +23.8 excess births over deaths 892.0
Actual & Projected Live Births, 1966-94 England and Wales High variant Actual Principal Low variant
Actual & Projected Live Births, 1966-94 England and Wales High variant Actual Principal Low variant
The Decennial Census • A census is (United Nations definition) ‘the simultaneous recording of demographic data by the government at a particular time, pertaining to all persons who live in a particular territory’
Therefore a census is: • Run by government • Covers a defined area • Personal enumeration (or a person in each household) • Simultaneous • Universal • Regular intervals (10 yrs England & Wales)
The census describes • Households and • People See 1991 specimen form in Handbook
Census data provides information of value to health workers: • Population structure, young, old, very old, ethnic minorities, household amenities – which in turn determine the structure of services. • Base populations for the calculation of fertility and mortality rates. • Deprivation measures e.g. DoE Index unemployment, overcrowding, lone pensioners, single parents, born in the new commonwealth, lacking basic amenities
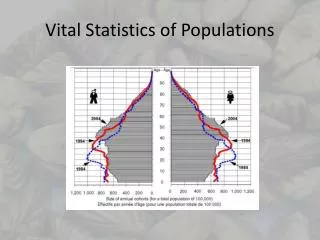
Europe: population by age and sex, 1950 - 2040 Male Female 1950 >80 75-79 70-74 65-69 60-64 55-59 50-54 45-49 40-44 35-39 30-34 25-29 20-24 15-19 10-14 5-9 0-4 30 20 10 0 0 10 20 30 Population (000s)
Europe: population by age and sex, 1950 - 2040 Male Female 2000 >80 75-79 70-74 65-69 60-64 55-59 50-54 45-49 40-44 35-39 30-34 25-29 20-24 15-19 10-14 5-9 0-4 30 20 10 0 0 10 20 30 Population (000s)
Europe: population by age and sex, 1950 - 2040 Male Female 2040 >80 75-79 70-74 65-69 60-64 55-59 50-54 45-49 40-44 35-39 30-34 25-29 20-24 15-19 10-14 5-9 0-4 30 20 10 0 0 10 20 30 Population (000s)
Population of Asians and Non-Asians in Leicester in 1988 70-74 65-69 60-64 55-59 50-54 45-49 40-44 35-39 30-34 25-29 Non Asians Asians Females Males 20 15 10 5 0 0 5 10 15 20 Percentage
Projected sub-populations in Leicester in 2008 70-74 65-69 60-64 55-59 50-54 45-49 40-44 35-39 30-34 25-29 Non Asians Asians Females Males 20 15 10 5 0 0 5 10 15 20 Percentage