Download
1 / 45
450 likes | 749 Views
CLUSTALW. MUSCLE. Sequence alignment:. Removing ambiguous positions:. T-COFFEE. FORBACK. SEQBOOT. Generation of pseudosamples:. PROTDIST. TREE-PUZZLE. PROTPARS. PHYML. Calculating and evaluating phylogenies: . NEIGHBOR. FITCH. SH-TEST in TREE-PUZZLE. CONSENSE.

E N D
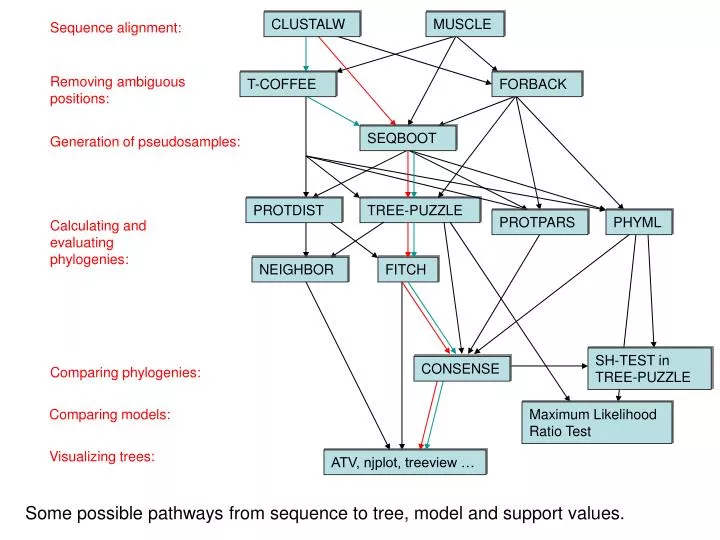
CLUSTALW MUSCLE Sequence alignment: Removing ambiguous positions: T-COFFEE FORBACK SEQBOOT Generation of pseudosamples: PROTDIST TREE-PUZZLE PROTPARS PHYML Calculating and evaluating phylogenies: NEIGHBOR FITCH SH-TEST in TREE-PUZZLE CONSENSE Comparing phylogenies: Comparing models: Maximum Likelihood Ratio Test Visualizing trees: ATV, njplot, treeview … Some possible pathways from sequence to tree, model and support values.
phyml PHYML - A simple, fast, and accurate algorithm to estimate large phylogenies by maximum likelihood An online interface is here ; there is a command line version that is described here (not as straight forward as in clustalw); a phylip like interface is automatically invoked, if you type “phyml” – the manual is here. The paper describing phyml is here, a brief interview with the authors is here
TreePuzzle ne PUZZLE TREE-PUZZLE is a very versatile maximum likelihood program that is particularly useful to analyze protein sequences. The program was developed by Korbian Strimmer and Arnd von Haseler (then at the Univ. of Munich) and is maintained by von Haseler, Heiko A. Schmidt, and Martin Vingron (contacts see http://www.tree-puzzle.de/).
TREE-PUZZLE • allows fast and accurate estimation of ASRV (through estimating the shape parameter alpha) for both nucleotide and amino acid sequences (see here for figures). • It has a “fast” algorithm to calculate trees through quartet puzzling (calculating ml trees for quartets of species and building the multispecies tree from the quartets). • The program provides confidence numbers (puzzle support values), which tend to be smaller than bootstrap values (i.e. provide a more conservative estimate), • the program calculates branch lengths and likelihood for user defined trees, which is great if you want to compare different tree topologies, or different models using the maximum likelihood ratio test. • Branches which are not significantly supported are collapsed. • TREE-PUZZLE runs on "all" platforms • TREE-PUZZLE reads PHYLIP format, and communicates with the user in a way similar to the PHYLIP programs.
Maximum likelihood ratio test If you want to compare two models of evolution (this includes the tree) given a data set, you can utilize the so-called maximum likelihood ratio test. If L1 and L2 are the likelihoods of the two models, d =2(logL1-logL2) approximately follows a Chi square distribution with n degrees of freedom. Usually n is the difference in model parameters. I.e., how many parameters are used to describe the substitution process and the tree. In particular n can be the difference in branches between two trees (one tree is more resolved than the other). In principle, this test can only be applied if on model is a more refined version of the other. In the particular case, when you compare two trees, one calculated without assuming a clock, the other assuming a clock, the degrees of freedom are the number of OTUs – 2 (as all sequences end up in the present at the same level, their branches cannot be freely chosen) . To calculate the probability you can use the CHISQUARE calculator for windows available from Paul Lewis.
TREE-PUZZLE allows (cont) • TREEPUZZLE calculates distance matrices using the ml specified model. These can be used in FITCH or Neighbor. • PUZZLEBOOT automates this approach to do bootstrap analyses – WARNING: this is a distance matrix analyses! • The official script for PUZZLEBOOT is here – you need to create a command file (puzzle.cmds), and puzzle needs to be envocable through the command puzzle. • Your input file needs to be the renamed outfile from seqboot • A slightly modified working version of puzzleboot_mod.sh is here, and here is an example for puzzle.cmds . Read the instructions before you run this! • Maximum likelihood mapping is an excellent way to • assess the phylogenetic information contained in a dataset. • ML mapping can be used to calculate the support around one branch. • @@@ Puzzle is cool, don't leave home without it! @@@
ml mapping From: Olga Zhaxybayeva and J Peter Gogarten BMC Genomics 2002, 3:4
ml mapping Figure 5. Likelihood-mapping analysis for two biological data sets. (Upper) The distribution patterns. (Lower) The occupancies (in percent)for the seven areas of attraction. (A) Cytochrome-b data fromref. 14. (B) Ribosomal DNA of major arthropod groups (15). From: Korbinian Strimmer and Arndt von HaeselerProc. Natl. Acad. Sci. USAVol. 94, pp. 6815-6819, June 1997
ml mapping can asses the topology surrounding an individual branch : E.g.: If we want to know if Giardia lamblia forms the deepest branch within the known eukaryotes, we can use ML mapping to address this problem. To apply ml mapping we choose the "higher" eukaryotes as cluster a, another deep branching eukaryote (the one that competes against Giardia) as cluster b, Giardia as cluster c, and the outgroup as cluster d. For an example output see this sample ml-map. An analysis of the carbamoyl phosphate synthetase domains with respect to the root of the tree of life is here.
ml mapping can asses the not necessarily treelike histories of genome Application of ML mapping to comparative Genome analyses see here for a comparison of different probability measures. Fig. 3: outline of approach Fig. 4: Example and comparison of different measures see here for an approach that solves the problem of poor taxon sampling that is usually considered inherent with quartet analyses.Fig. 2: The principle of “analyzing extended datasets to obtain embedded quartets” Example next slides:
(a,b)-(c,d) /\ / \ / \ / 1 \ / \ / \ / \ / \ / \/ \ / 3 : 2 \ / : \ /__________________\ (a,d)-(b,c) (a,c)-(b,d)Number of quartets in region 1: 68 (= 24.3%)Number of quartets in region 2: 21 (= 7.5%)Number of quartets in region 3: 191 (= 68.2%)Occupancies of the seven areas 1, 2, 3, 4, 5, 6, 7: (a,b)-(c,d) /\ / \ / 1 \ / \ / \ / /\ \ / 6 / \ 4 \ / / 7 \ \ / \ /______\ / \ / 3 : 5 : 2 \ /__________________\ (a,d)-(b,c) (a,c)-(b,d)Number of quartets in region 1: 53 (= 18.9%) Number of quartets in region 2: 15 (= 5.4%) Number of quartets in region 3: 173 (= 61.8%) Number of quartets in region 4: 3 (= 1.1%) Number of quartets in region 5: 0 (= 0.0%) Number of quartets in region 6: 26 (= 9.3%) Number of quartets in region 7: 10 (= 3.6%) Cluster a: 14 sequencesoutgroup (prokaryotes) Cluster b: 20 sequencesother Eukaryotes Cluster c: 1 sequencesPlasmodium Cluster d: 1 sequences Giardia
TREE-PUZZLE – PROBLEMS/DRAWBACKS • The more species you add the lower the support for individual branches. While this is true for all algorithms, in TREE-PUZZLE this can lead to completely unresolved trees with only a few handful of sequences. • Trees calculated via quartet puzzling are usually not completely resolved, and they do not correspond to the ML-tree:The determined multi-species tree is not the tree with the highest likelihood, rather it is the tree whose topology is supported through ml-quartets, and the lengths of the resolved branches is determined through maximum likelihood.
puzzle example The “best” tree might not be the true tree. When can one conclude that a tree is a significantly worse explanation for the data compared to the best tree? Estimate the probability that a dataset might have resulted from a given tree. Example: Kira’s kangaroo data Usertrees - SH test - go through outfile (PARS, PROTPARS and DNAPARS perform a similar test when confronted with multiple usertrees)
COMPARISON OF DIFFERENT SUPPORT MEASURES A: mapping of posterior probabilities according to Strimmer and von Haeseler B: mapping of bootstrap support values C: mapping of bootstrap support values from extended datasets Zhaxybayeva and Gogarten, BMC Genomics 2003 4: 37
bootstrap values from extended datasets More gene families group species according to environment than according to 16SrRNA phylogeny In contrast, a themophilic archaeon has more genes grouping with the thermophilic bacteria ml-mapping versus
P(data|model, I) P(model|data, I) = P(model, I) P(data,I) Likelihood describes how well the model predicts the data Bayes’ Theorem Posterior Probability represents the degree to which we believe a given model accurately describes the situation given the available data and all of our prior information I Prior Probability describes the degree to which we believe the model accurately describes reality based on all of our prior information. Normalizing constant Reverend Thomas Bayes (1702-1761)
Elliot Sober’s Gremlins Observation: Loud noise in the attic ? Hypothesis: gremlins in the attic playing bowling Likelihood = P(noise|gremlins in the attic) P(gremlins in the attic|noise) ? ?
Li pi= L1+L2+L3 Ni pi Ntotal Alternative Approaches to Estimate Posterior Probabilities Bayesian Posterior Probability Mapping with MrBayes(Huelsenbeck and Ronquist, 2001) Problem: Strimmer’s formula only considers 3 trees (those that maximize the likelihood for the three topologies) Solution: Exploration of the tree space by sampling trees using a biased random walk (Implemented in MrBayes program) Trees with higher likelihoods will be sampled more often ,where Ni - number of sampled trees of topology i, i=1,2,3 Ntotal – total number of sampled trees (has to be large)
Illustration of a biased random walk Figure generated using MCRobot program (Paul Lewis, 2001)
Spectral Decomposition of Phylogenetic Data Phylogenetic information present in genomes Break information into small quanta of information (bipartitions or embedded quartets) Analyze spectra to detect transferred genes and plurality consensus.
BIPARTITION OF A PHYLOGENETIC TREE Bipartition (or split) – a division of a phylogenetic tree into two parts that are connected by a single branch. It divides a dataset into two groups, but it does not consider the relationships within each of the two groups. Yellowvs Rest * ** .. .** 95 compatible to illustratedbipartition Orange vs Rest. .* . . ..* * ** . . .. . incompatible to illustratedbipartition
“Lento”-plot of 34 supported bipartitions (out of 4082 possible) • 13 gamma- • proteobacterial • genomes (258 putative orthologs): • E.coli • Buchnera • Haemophilus • Pasteurella • Salmonella • Yersinia pestis (2 strains) • Vibrio • Xanthomonas (2 sp.) • Pseudomonas • Wigglesworthia There are 13,749,310,575 possible unrooted tree topologies for 13 genomes
Consensus clusters of eight significantly supported bipartitions Phylogeny of putatively transferred gene(virulence factor homologs (mviN)) only 258 genes analyzed
“Lento”-plot of supported bipartitions (out of 501 possible) • 10 cyanobacteria: • Anabaena • Trichodesmium • Synechocystis sp. • Prochlorococcus marinus (3 strains) • Marine Synechococcus • Thermo- synechococcus elongatus • Gloeobacter • Nostoc punctioforme Number of datasets Based on 678 sets of orthologous genes Zhaxybayeva, Lapierre and Gogarten, Trends in Genetics, 2004, 20(5): 254-260.
The phylogeny of ribulose bisphosphate carboxylase large subunit Consensus clusters corresponding to three significantly supported bipartitions Zhaxybayeva, Lapierre and Gogarten, Trends in Genetics, 2004, 20(5): 254-260.
Example of bipartition analysis for five genomes of photosynthetic bacteria(188 gene families) Bipartitions supported by genes from chlorophyll biosynthesis pathway total 10 bipartitions R: Rhodobacter capsulatus, H: Heliobacillus mobilis, S: Synechocystis sp., Ct: Chlorobium tepidum, Ca: Chloroflexus aurantiacus H Ca R Zhaxybayeva, Hamel, Raymond, and Gogarten, Genome Biology 2004, 5: R20 Plurality Ct S R Ca H Chl. Biosynth. Ct S
Phylogenetic Analyses of Genes from chlorophyll biosynthesis pathway (extended datasets) Xiong et al. Science, 2000 289:1724-30 Zhaxybayeva, Hamel, Raymond, and Gogarten, Genome Biology 2004, 5: R20 R: Rhodobacter capsulatus, H: Heliobacillus mobilis, S: Synechocystis sp., Ct: Chlorobium tepidum, Ca: Chloroflexus aurantiacus
PROBLEMS WITH BIPARTITIONS • No easy way to incorporate gene families that are not represented in all genomes. • The more sequences are added, the shorter the internal branches become, and the lower is the bootstrap support for the individual bipartitions. • A single misplaced sequence can destroy all bipartitions.
:embedded quartet for genomes 1, 4, 9, and 10 . This bootstrap sample supports the topology ((1,4),9,10). Bootstrap support values for embedded quartets : tree calculated from one pseudo-sample generated by bootstraping from an alignmentof one gene family present in 11 genomes + 9 9 10 1 1 1 10 4 10 9 4 4 Zhaxybayeva et al. 2006, Genome Research, in press Quartet spectral analyses of genomes iterates over three loops: • Repeat for all bootstrap samples. • Repeat for all possible embedded quartets. • Repeat for all gene families.
Iterating over Bootstrap Samples This gene family for the quartet of species A, B, C, D Supports the Topology ((A, D), B, C) with 70% bootstrap support
:embedded quartet for genomes 1, 4, 9, and 10 . This bootstrap sample supports the topology ((1,4),9,10). Bootstrap support values for embedded quartets : tree calculated from one pseudo-sample generated by bootstraping from an alignmentof one gene family present in 11 genomes + 9 9 10 1 1 1 10 4 10 9 4 4 Quartet spectral analyses of genomes iterates over three loops: • Repeat for all bootstrap samples. • Repeat for all possible embedded quartets. • Repeat for all gene families.
Illustration of one component of a quartet spectral analysesSummary of phylogenetic information for one genome quartet for all gene families Total number of gene families containing the species quartet Number of gene families supporting the same topology as the plurality (colored according to bootstrap support level) Number of gene families supporting one of the two alternative quartet topologies
Quartet Spectrum of 11 cyanobacterialgenomes 330 possible quartets 1128 datasets from relaxed core (core datasets + datasets with one or two taxa missing) Number of datasets 685 datasets show conflicts with plurality quartets
Conflicts with plurality signal are observed in sets of orthologs across all functional categories, including genes involved in translation and transcription 624/1128 ≈ 55%
Genes with orthologs outside the cyanobacterial phylum: Distribution among Functional Categories (using COG db, release of March 2003) Cyanobacteria do form a coherent group, but conflict with plurality (294) 700 phylogenetically useful extended datasets Cyanobacteria do not form a coherent group (160)
Species evolution versus plurality consensus • In case of the marine Synecchococcus and Prochlorococcus spp. the plurality consensus is unlikely to reflect organismal history. • This is probably due to frequent gene transfer mediated by phages e.g.: • These conflicting observations are not limited to pro-karyotes. In incipient species of Darwin’s finches frequentintrogression can make some individuals characterized by morphology and mating behavior as belonging to the same species genetically more similar to a sister species (Grant et al. 2004 “Convergent evolution of Darwin's finches caused by introgressive hybridization and selection” Evolution Int J Org Evolution 58, 1588-1599).
Coalescence – the process of tracing lineages backwards in time to their common ancestors. Every two extant lineages coalesce to their most recent common ancestor. Eventually, all lineages coalesce to the cenancestor. t/2 (Kingman, 1982) Illustration is from J. Felsenstein, “Inferring Phylogenies”, Sinauer, 2003
Coalescence ofORGANISMALandMOLECULAR Lineages Time • 20 lineages • One extinction and one speciation event per generation • One horizontal transfer event once in 5 generations (I.e., speciation events) • RED: organismal lineages (no HGT) • BLUE: molecular lineages (with HGT) • GRAY: extinct lineages • RESULTS: • Most recent common ancestors are different for organismal and molecular phylogenies • Different coalescence times • Long coalescence time for the last two lineages
Y chromosome Adam Mitochondrial Eve Lived approximately 50,000 years ago Lived 166,000-249,000 years ago Thomson, R. et al. (2000) Proc Natl Acad Sci U S A 97, 7360-5 Underhill, P.A. et al. (2000) Nat Genet 26, 358-61 Cann, R.L. et al. (1987) Nature 325, 31-6 Vigilant, L. et al. (1991) Science 253, 1503-7 Albrecht Dürer, The Fall of Man, 1504 Adam and Eve never met The same is true for ancestral rRNAs, EF, ATPases!
Lineages Through Time Plot 10 simulations of organismal evolution assuming a constant number of species (200) throughout the simulation; 1 speciation and 1 extinction per time step. (green O) 25 gene histories simulated for each organismal history assuming 1 HGT per 10 speciation events (red x) log (number of surviving lineages) green:organismal lineages ; red:molecular lineages (with gene transfer)
The deviation from the “long branches at the base” pattern could be due to • under sampling • an actual radiation • due to an invention that was not transferred • following a mass extinction Bacterial 16SrRNA based phylogeny(from P. D. Schloss and J. Handelsman, Microbiology and Molecular Biology Reviews, December 2004.)