Download
1 / 44
440 likes | 560 Views
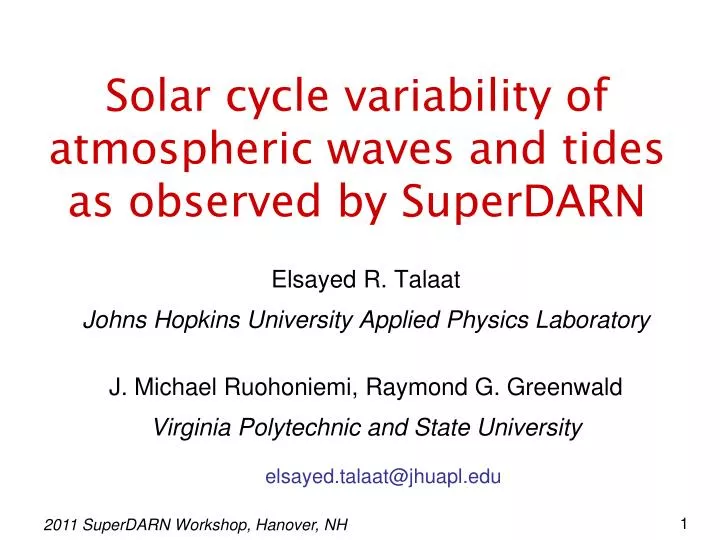
Solar cycle variability of atmospheric waves and tides as observed by SuperDARN . Elsayed R. Talaat Johns Hopkins University Applied Physics Laboratory J. Michael Ruohoniemi, Raymond G. Greenwald Virginia Polytechnic and State University. elsayed.talaat@jhuapl.edu. SuperDARN HF Radars.

E N D
Solar cycle variability of atmospheric waves and tides as observed by SuperDARN Elsayed R. Talaat Johns Hopkins University Applied Physics Laboratory J. Michael Ruohoniemi, Raymond G. Greenwald Virginia Polytechnic and State University elsayed.talaat@jhuapl.edu
SuperDARN–insights into mesopause activity • Mesopause dynamics dominated by waves • Cause of day-to-day, seasonal, and interannual variability • Drivers of the mean structure of the mesosphere and lower thermosphere • SuperDARN meteor wind analysis: • Daily specification of tides and planetary waves • De-aliasing of tidal modes • Non-linear interaction between planetary waves and tides • Long-term analysis of inter-annual and solar cycle variations • 73-day oscillation, QBO, solar cycle, SSW • Six NH radars with >10 years of near continuous data are used: • Kapuskasing, Saskatoon, Goose Bay, Hankasalmi, Stokkseyri, Pykkvibaer
Periodicities in the meridional wind diurnal > semidiurnal semiannual > annual
Periodicities in the meridional wind diurnal < semidiurnal semiannual > annual
Periodicities in the meridional wind diurnal < semidiurnal semiannual > annual
Periodicities in the meridional wind diurnal << semidiurnal semiannual < annual
Periodicities in the meridional wind diurnal < semidiurnal semiannual << annual
Periodicities in the meridional wind diurnal << semidiurnal semiannual < annual
Forcing of Thermal Tides Extreme & Far Ultraviolet O Solar Cycle Altitude (km) Thermosphere Schumann-Runge Bands & Continuum SAO O2 ~90 km Mesosphere Ultraviolet O3 QBO ~30 km Stratosphere Troposphere ~15 km H2O Infrared Latent Heat Sensible Heat Temperature
Summary • At mid- and high-latitudes, a persistent 73-day oscillation observed in the meteor winds. Also seen as a variability in semidiurnal tidal amplitudes. Semiannual variation is larger than annual at low- latitudes; vice versa at high-latitudes. • Semidiurnal tide becomes the dominant tide at mid- and high-latitudes. • Both diurnal and semidiurnal tide show evidence of solar cycle variability. Not much variation at QBO frequency in the meteor winds. • Planetary wave activity peaks at ~2, 5, 8, 10, 15, 25 days • QBO signatures associated with sudden stratospheric warming. • Significant variability in the long-term analysis of planetary waves at different radars. Solar cycle variability peaks at Kapuskasingand Saskatoon.
Open Questions… • Why 73 days (and not 120, etc.)? Geomagnetic effect? • Go to the source - examination of lower atmosphere water vapor from MODIS on Aqua and Terra and ozone from TIMED
Tides from TIMED/SABER The migrating (W1) (top) and eastward s=3 diurnal (DE3) (middle) amplitude extracted from TIMED/SABER temperatures (v1.07) at the equator at 90 km and 110 km, respectively. The suppressed amplitudes during 2003, 2005, and 2007 correspond to the westward (blue) phase of the QBO (bottom). Contours are 10 m/sec. Several other tidal modes are of secondary importance.
Acknowledgements The authors are grateful from for support from NSF CEDAR Award 0640864 and the NSF Cooperative Agreement ATM-0418101.
SuperDARN HF RadarsMesospheric neutral wind measurements Saskatoon Kapuskasing Goose Bay Hankasalmi Stokkseyri Pykkvibaer
Stratospheric Warming • Rise in stratospheric temperatures due to the associated breakdown of polar vortex winds • Northern hemisphere has minor warmings every winter and major warmings every ~ 2 years • Southern hemisphere rarely has major warmings • Mesosphere and thermosphere temperature and wind response • Connections to low latitude QBO • Planetary wave amplification and propagation