Download
1 / 29
300 likes | 485 Views
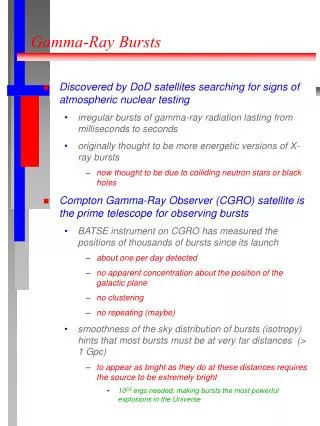
Radio afterglows of Gamma Ray Bursts. Poonam Chandra National Centre for Radio Astrophysics - Tata Institute of Fundamental Research Collaborators: Dale Frail and many others. Gamma Ray Bursts. Meszaros and Rees 1997. Radio Afterglows. Late time follow up.

E N D
Radio afterglows of Gamma Ray Bursts Poonam Chandra National Centre for Radio Astrophysics - Tata Institute of Fundamental Research Collaborators: Dale Frail and many others
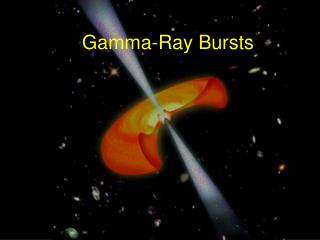
Gamma Ray Bursts Meszaros and Rees 1997
Radio Afterglows • Late time follow up. • Accurate energetics instead of “isotropic equivalent” energy . • Radio scintillation: Constraints on fireball size (Goodman 1997). • Density estimation
Radio Afterglows: GRB 970508Frail et al. 2000, 1997, Waxman et al. 1998 • Diffractive scintillation size constraint (<1017cm). • Energetics from long lived afterglow E0=5 x 1050 ergs. • Density ~0.5 cm-2,
Radio Detection Statistics • 95 out of 304 GRBs detected in radio – 31% • Pre-Swift radio detection 42/123 – 34% • Post-Swift radio detection 53/181 – 29% • X-ray detection rate 42% (pre-Swift) to 93% (post-Swift) . • Optical detection rate 48% (pre-Swift) to 75% (post-Swift) . Chandra et al. 2012, ApJ 746, 156
Detectability of radio afterglows - redshift Kolmogorov-Smirnov test P=0.61 No strong redshift dependence z<2=47/88 z>2=21/43. Chandra et al. 2012, ApJ 746, 156
Negative K-correction (Ciardi and Loeb 2000)(detectable at high redshifts) Chandra et al. 2012, Frail et al. 2006
GRBs detected at high redshift • GRB 090423, z=8.3 (Chandra et al. 2010) • GRB 050904, z=6.3 (Gou et al. 2007) • GRB 120508C z>6 (Laskar et al. 2013)
Detectability of radio afterglows - fluence P=2.6x10⁻⁷ • 176/206 (85%) non-detections fluence <1x10⁻⁶ erg cm-2 • 82/95 (86%) detections fluence>1x10⁻⁶ erg cm-2 Nysewander et al. 2009, Swirt XRT repository Chandra et al. 2012, ApJ 746, 156
Detectability of radio afterglows - Energy P=9x10⁻⁷ • k-corrected bolometric in 1 keV-10 MeV range 144 grbs • 60/95 detections Energy >1x1053 erg • Only 9/206 non-detections Energy >1x1053 erg Chandra et al. 2012, ApJ 746, 156
Detectability of radio afterglows - Energy Beaming corrected bolometric energy Where fb is the beaming fraction P=3.5x10⁻³ Chandra et al. 2012, ApJ 746, 156
Detectability of radio afterglows – X-ray and optical P=3x10⁻⁶ P=1x10⁻⁹ Gehrels et al. 2008, de Pasquale et al. 2006, Sakamoto et al.2008, 2011 Chandra et al. 2012, ApJ 746, 156
What determines radio flux? Isotropic Energy R-index=0.12 Fluence R-index=0.02 X-ray flux R-index=-0.05 Optical flux R-index=0.62
Radio Detection Biases Chandra et al. 2012, ApJ 746, 156
Sample bias or different population? (Hancock et al. 2013) • Chandra et al. (2012) sensitivity limited. • Hancock et al. (2013):visibility stacking- two different populations. • No more than 70% of GRB afterglows are truly radio-bright. • Radio quiet GRBs are intrinsically weak GRBs at all wavelengths. • Gamma-ray efficiency of the prompt emission is responsible for the difference between the two populations. • One magnetar-driven, and one black-hole-driven, as gamma ray efficiency inversely proportional to magnetic field.
Reverse shocks in radio Kulkarni et al. 1999
Radio Reverse Shocks • Possible Reverse Shock (RS) in 24 GRBs. • But 87 GRBs with no early radio data for t<3 days. • About 1:4 radio AG may be RS • In optical bands, RS is seen in 1 every 24 GRBs.
Reverse shocks in Radio GRBs Chandra et al.2014
GRB 130427A: Evidence of RS Laskar et al. 2013 • Observations with VLA, GMRT, CARMA and combined with optical/IR/UV and X-ray bands. • Most detailed modeling of RS. Wind medium with low density prefered.
Conclusions (Questions?) • Are radio loud and radio quiet two different populations? • Why are reverse shocks more prominent in radio bands?
Reverse Shock Emission fit For reverse shock For forward shock
Statistical Methods • K-M estimator (Kaplan-Meier estimator): Survival analysis for data including the upper limits (Feigelson & Nelson 1985). • K-S test (Kolmogorov-Smirnov test): Tries to determine if 2 datasets differ significantly. P-value is its indicative probability. • Pearson R- coefficient: A measure of linear relationship between two variables. -1<R<1.
K-corrected Luminosity • Luminosity L = 4 p F dL2/(1+z) • K-correction factor (1+z)a-b (where F ~ tanb) • K-corrected luminosity L = 4 p F dL2(1+z)a-b-1 • For optically thin post-jet break light curve a=0, b=1/3 (Frail et al. 2006)
Bursts of different Classes Chandra et al. 2012, ApJ 746, 156
Radio Detection Biases Upper limits detection Chandra et al. 2012, ApJ 746, 156