Download
1 / 45
460 likes | 695 Views
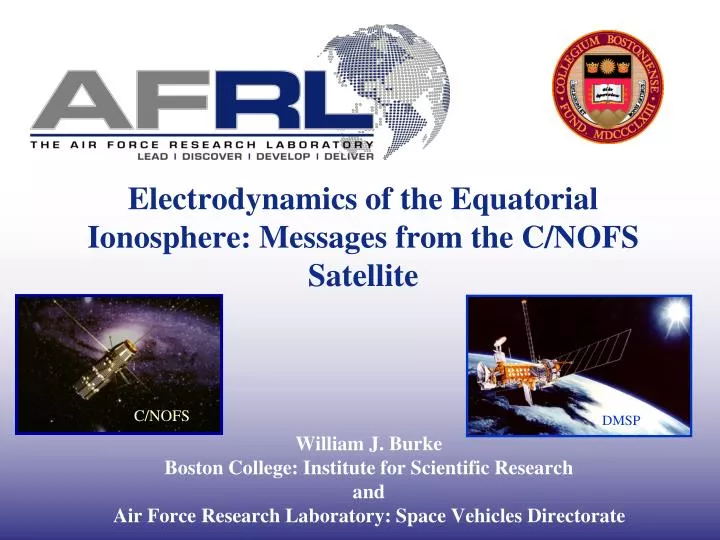
C/NOFS. DMSP. Electrodynamics of the Equatorial Ionosphere: Messages from the C/NOFS Satellite. William J. Burke Boston College: Institute for Scientific Research and Air Force Research Laboratory: Space Vehicles Directorate. C/NOFS Satellite Mission Outline.

E N D
C/NOFS DMSP Electrodynamics of the Equatorial Ionosphere: Messages from the C/NOFS Satellite William J. Burke Boston College: Institute for Scientific Research and Air Force Research Laboratory: Space Vehicles Directorate
C/NOFS Satellite Mission Outline • Background:(a) Scintillations: A perennial issue(b) Generalized Rayleigh-Taylor instability (c) Desert Storm: January 1991 (d) Three-pronged approach: SCINDA - C/NOFS - PBMOD • The Long Wait: 1995 - 2008 (a) DMSP as a C/NOFS surrogate (b) Season-longitude climatology of equatorial plasma bubbles (c) Stormtime equatorial ionosphere • Post-C/NOFS launch; April 17, 2008 (a) The strange world of deep solar minimum (b) Season-longitude climatology of deep dawn sector depletions (c) Revelatory comparison with SCINDA measurements
C/NOFS Satellite Mission UHF – L Band Scintillations For 250 MHz signals with d = 300 km (altitude of F-layer peak in solar minimum) Fresnel length is ~ 850 m
C/NOFS Satellite Mission Outline • Background:(a) Scintillations: A perennial issue(b) Generalized Rayleigh-Taylor instability (c) Desert Storm: January 1991 (d) Three-pronged approach: SCINDA - C/NOFS - PBMOD • The Long Wait: 1995 - 2008 (a) DMSP as a C/NOFS surrogate (b) Season-longitude climatology of equatorial plasma bubbles (c) Stormtime equatorial ionosphere • Post-C/NOFS launch: April 17, 2008 (a) The strange world of deep solar minimum (b) Season-longitude climatology of deep dawn sector depletions (c) Revelatory comparison with SCINDA measurements
C/NOFS Satellite Mission Equatorial Electrodynamics Linear Stage Generalized Rayleigh-Taylor Instability Exponential Growth Neutral Wind Gravity Growth Rate Electric Field Nonlinear Stage Magnetic Field Log Density Gradient Conductance R-T growth rates are controlled by the variability of E, Un, ΣE, ΣF, veff, and through the flux-tube integrated quantities by the height of the F layer.
C/NOFS Satellite Mission Outline • Background:(a) Scintillations: A perennial issue(b) The generalized Rayleigh-Taylor instability (c) Desert Storm: January 1991 (d) Three-pronged response: SCINDA - C/NOFS - PBMOD • The Long Wait: 1995 - 2008 (a) DMSP as a C/NOFS surrogate (b) Season-longitude climatology of equatorial plasma bubble (c) Comparison with JULIA radar measurements (d) Stormtime equatorial ionosphere • Post-C/NOFS launch; April 17, 2008 (a) The strange new world of deep solar minimum (b) Season-longitude climatology of deep dawn sector depletions (c) Revelatory comparison with SCINDA measurements
C/NOFS Satellite Mission Desert Storm Experience Strait of Hormuz Saudi Arabia • During the lead up to Desert Storm counter offensive radio links between commanders and DOD personnel in theater and the US failed. • GPS receivers given to front-line soldiers were useless. • C/NOFS program designed in response to nav / com breakdowns caused by the disturbed ionosphere • In preparation for the C/NOFS mission we exploited database of equatorial plasma bubble (EPB) encountered by DMSP satellites in the evening local time sector.
C/NOFS Satellite Mission Outline • Background:(a) Scintillations: A perennial issue(b) The generalized Rayleigh-Taylor instability (c) Desert Storm: January 1991 (d) Three-pronged approach: SCINDA - C/NOFS - PBMOD • The Long Wait: 1995 - 2008 (a) DMSP as a C/NOFS surrogate (b) Season-longitude climatology of equatorial plasma bubbles (c) Stormtime equatorial ionosphere • Post-C/NOFS launch; April 17, 2008 (a) The strange world of deep solar minimum (b) Season-longitude climatology of deep dawn sector depletions (c) Revelatory comparison with SCINDA measurements
C/NOFS Satellite Mission Approach SEVERE MODERATE WEAK C/NOFS Mission Response: Ground- and Space-based Measurements Satellite Links Terminator SCINDA = Scintillation Network Decision Aid - Planar Langmuir Probe (PLP) - Vector Electric Field Instrument - Ion Velocity Meter (IVM) - Neutral Wind Meter - GPS Occultation Receiver - RF Radio Beacon • Pegasus launch • 13 inclination • 850 by 400 km
C/NOFS Satellite Mission Approach Simulated Birth and Growth of Equatorial Plasma Bubbles • PBMod snapshots of plasma density by altitude and longitude at five local times in the equatorial plane • C/NOFS encounters EPBs at all stages of development • Explains enhanced density C/NOFS observes when flying above rising depletions
C/NOFS Satellite Mission Outline • Background:(a) Scintillations: A perennial issue(b) The generalized Rayleigh-Taylor instability (c) Desert Storm: January 1991 (d) Three-pronged approach: SCINDA - C/NOFS - PBMOD • The Long Wait: 1995 - 2008 (a) DMSP as a C/NOFS surrogate (b) Season-longitude climatology of equatorial plasma bubbles (c) Stormtime equatorial ionosphere • Post-C/NOFS launch; April 17, 2008 (a) The strange world of deep solar minimum (b) Season-longitude climatology of deep dawn sector depletions (c) Revelatory comparison with SCINDA measurements
C/NOFS Satellite MissionThe DMSP Surrogate M-0 M-1 M-2 M-3 South EQNorth DMSP Observations of EPBs 1989 - 2006 EPBs observed by DMSP M - 0 if N 2 M - 1 if 2 < N 10 M - 2 if 10 < N 100 M - 3 if N > 100
C/NOFS Satellite Mission Outline • Background:(a) Scintillations: A perennial issue(b) Generalized Rayleigh-Taylor instability (c) Desert Storm: January 1991 (d) Three-pronged approach: SCINDA - C/NOFS - PBMOD • The Long Wait: 1995 - 2008 (a) DMSP as a C/NOFS surrogate (b) Season-longitude climatology of equatorial plasma bubbles (c) Stormtime equatorial ionosphere • Post-C/NOFS launch; April 17, 2008 (a) The strange world of deep solar minimum (b) Season-longitude climatology of deep dawn sector depletions (c) Revelatory comparison with SCINDA measurements
C/NOFS Satellite Mission Season – Longitude Expectation Season-Longitude Variability of Equatorial Plasma Bubbles Terminator alignment with magnetic field in mid-Atlantic Winter Solstice Equinox
EPB Occurrence Rates 1989 – 1992 Solar Maximum Africa Pacific America Atlantic India Pacific { Longitude SAA C/NOFS Satellite Mission Season – Longitude Distribution During 1989 – 1992 solar maximum, EPBs occurred throughout the year in the Atlantic-Africa sector; rates highest from September to December.
EPB Occurrence Rates 1999 – 2002 Solar Maximum Pacific America Atlantic Africa India Pacific { Longitude SAA C/NOFS Satellite Mission Season – Longitude Distribution In 1999 – 2002 solar maximum, EPB occurrence rates are fairly symmetric; high in the America-Atlantic-Africa sector both early and late in the year.
EPB Occurrence Rates 1994 – 1997 Solar Minimum Africa Pacific America Atlantic India Pacific { SAA Longitude C/NOFS Satellite Mission Season – Longitude Distribution During 1994 – 1997 solar minimum, EPB occurrence rates were ~ 5% most of the time. Highest rates were recorded in the America-Atlantic-Africa sector January to March.
EPB Occurrence Rates 1993 Transition Year Pacific America Atlantic Africa India Pacific { Longitude SAA C/NOFS Satellite Mission Season – Longitude Distribution During 1993 transition year, EPB occurrence rates were highest in the Atlantic-Africa sector early in the year, January to April.
EPB Occurrence Rates 1998 Transition Year Africa Pacific America Atlantic India Pacific { Longitude SAA C/NOFS Satellite Mission Season – Longitude Distribution During 1998 transition year, EPB occurrence rates are higher in the America-Atlantic-Africa sector late in the year, September to November.
EPB Occurrence Rates 2003 Transition Year C/NOFS Satellite Mission Season – Longitude Distribution Pacific America Atlantic Africa India Pacific { Longitude SAA During 2003 transition year, EPB occurrence rates are higher in the America-Atlantic-Africa sector late in the year, September to December.
C/NOFS Satellite Mission Outline • Background:(a) Scintillations: A perennial issue(b) Generalized Rayleigh-Taylor instability (c) Desert Storm: January 1991 (d) Three-pronged approach: SCINDA - C/NOFS - PBMOD • The Long Wait: 1995 - 2008 (a) DMSP as a C/NOFS surrogate (b) Season-longitude climatology of equatorial plasma bubbles (c) Stormtime equatorial ionosphere • Post-C/NOFS launch; April 17, 2008 (a) The strange world of deep solar minimum (b) Season-longitude climatology of deep dawn sector depletions (c) Revelatory comparison with SCINDA measurements
C/NOFS Satellite Mission Stormtime Equatorial Ionosphere • Vertical lines superposed onto the Dst trace indicate times when DMSP F9 crossed plasma bubbles near magnetic equator - 21:00 LT • CRRES detected dawn-to-dusk E fields earthward of ring current ions at times of all stormtime EPBs [Wygant et al. JGR, 103, 29,527, 1998]. • Regular EBP pattern took ~4 days to re-emerge after recovery began. With solar EUV power ~ 500 GW, why did it take four days to restore pre-storm quiet time EPB rate?
C/NOFS Satellite Mission Outline • Background:(a) Scintillations: A perennial issue(b) Generalized Rayleigh-Taylor instability (c) Desert Storm: January 1991 (d) Three-pronged approach: SCINDA - C/NOFS - PBMOD • The Long Wait: 1995 - 2008 (a) DMSP as a C/NOFS surrogate (b) Season-longitude climatology of equatorial plasma bubbles (c) Stormtime equatorial ionosphere • Post-C/NOFS launch; April 17, 2008 (a) The strange world of deep solar minimum (b) Season-longitude climatology of deep dawn sector depletions (c) Revelatory comparison with SCINDA measurements
C/NOFS Satellite Mission Evening Sector Depletions DMSP evening sector EPB climatology for solar max confirmed Tsunoda’s [1985] model Most EPBs were observed in Atlantic-Africa sector and when terminator aligned with magnetic field Previous solar min: Sparse but consistent This solar min: Nothing yet!
C/NOFS Satellite Mission Equatorial Electrodynamics C/NOFS PLP: 20 January 2010 Orbit 9558 10:08:35 UT 20 January 2010 Orbit 9559 11:45:29 UT Orbit 9558: PLP observed wide depletion ~ 10:50 UT at ~240° E, 400 km alt Orbit 9559: Narrow, deep depletion at observed ~12:30 UT at ~240° E, 450 km alt
C/NOFS Satellite Mission Equatorial Electrodynamics CIR HSS • Between 12 and 19 June 2008 a high-speed stream (HSS) in the solar wind passed Earth • Interplanetary magnetic field (IMF) compressed and rotated in the corotating interaction region (CIR) at the HSS leading edge • Excited indicated geomagnetic activity
Equatorial Electrodynamics • PLP measured responses during (Orbit 878) and after (Orbit 879) the CIR excited AE disturbance. • As time passed, 100 km (EPB) scale structures coalesced into a • single large > 1000 km depletion. • Larger structure co-rotated to dawn meridian and was lost to refilling. • Not all dawn sector depletions have interplanetary sources but • appear “spontaneously” probably due to mi (g × B) currents.
C/NOFS Satellite Mission Outline • Background:(a) Scintillations: A perennial issue(b) The generalized Rayleigh-Taylor instability (c) Desert Storm: January 1991 (d) Three-pronged response: SCINDA - C/NOFS - PBMOD • The Long Wait: 1995 - 2008 (a) DMSP as a C/NOFS surrogate (b) Season-longitude climatology of equatorial plasma bubbles (c) Comparison with JULIA radar measurements (d) Stormtime equatorial ionosphere • Post-C/NOFS launch; April 17, 2008 (a) The strange world of deep solar minimum (b) Season-longitude climatology of deep dawn sector depletions (c) Revelatory comparison with SCINDA measurements
C/NOFS Satellite Mission Dawn Sector Depletions C/NOFS PLP: 20 January 2010 Orbit 9558 10:08:35 UT 20 January 2010 Orbit 9559 11:45:29 UT Orbit 9558: PLP observed wide depletion ~ 10:50 UT at ~240° E, 400 km alt Orbit 9559: Narrow, deep depletion observed ~12:30 UT at ~240° E, 450 km alt
C/NOFS Satellite Mission Dawn Sector Depletions DMSP and C/NOFS: Latitudinal and Longitudinal Extent UT GLon GLat Alt UT GLon GLat Alt F17 F15 Irregularities observed over 40° in latitude and 20° in longitude UT GLon GLat Alt C/NOFS
C/NOFS Satellite Mission Dawn Sector Depletions DMSP F17 dawn sector EPB rates for 2008 near 5:30 MLT are dramatically different from any evening sector observations. Maximum rates (~ 70%) occur near the June solstice in the America-Atlantic sector. Rates are ~ 30% in the Pacific near the December solstice and < 10% when the dusk terminator aligns with the magnetic field. Dotted lines mark times the dawn terminator aligns with the magnetic field.
C/NOFS Satellite Mission Outline • Background:(a) Scintillations: A perennial issue(b) The generalized Rayleigh-Taylor instability (c) Desert Storm: January 1991 (d) Three-pronged response: SCINDA - C/NOFS - PBMOD • The Long Wait: 1995 - 2008 (a) DMSP as a C/NOFS surrogate (b) Season-longitude climatology of equatorial plasma bubbles (c) Comparison with JULIA radar measurements (d) Stormtime equatorial ionosphere • Post-C/NOFS launch; April 17, 2008 (a) The strange world of deep solar minimum (b) Season-longitude climatology of deep dawn sector depletions (c) Revelatory comparison with SCINDA measurements
C/NOFS Satellite Mission • During the night of 13 - 14 January 2010, S4 > 0.6 scintillation activity for 250 MHz signals was observed at three SCINDA sites • Simultaneous measurements by the Planar Langmuir Probe (PLP) and Ion Velocity Meter (IVM) on C/NOFS suggest that two types of density irregularities exist at topside altitudes: • Equatorial plasma bubbles (EPBs): upward drifting depletions • Upward/downward drifting topside density enhancements / depletions depletions that map to image depletions / enhancements on the bottomside. • Consistent with the phase-screen approximation, power spectral densities from PLP and VEFI data streams indicate significant power at Fresnel scale. - For 250 MHz carrier and hmF2 300 km, . Power spectral densities and theoretical modeling suggest that density irregularities encountered by C/NOFS at topside altitudes were conjugate to those responsible for the 250 MHz scintillations.
C/NOFS Satellite MissionSCINDA - Satellite Comparison Latitude = 16.7º N Longitude = 337.1º E Cape Verde Sao Luis Brazil 9462 Latitude = 2.6º S Longitude = 315.8º E Google S4: 250 MHz Ancon 9464 Latitude = 11.8º S Longitude = 282.9º E Google Intermittent episodes of strong scintillation (S4 > 0.6) recorded at Sao Luis, Brazil, and Cape Verde from 22:00 UT on 13 January through 04:00 UT on 14 January 2010. 9466
C/NOFS Satellite MissionSCINDA - Satellite Comparison 13 January 2010 Orbit 9462 23:05:05 UT Darkness Fresnel Scale • IVM crossed a sequence of upward drifting density depletions with embedded small scale irregularities • C/NOFS crossed equatorial plasma bubbles at topside altitudes. • VEFI data indicate return of PRE. Mag. Equator Orbit PLP detected density irregularities near perigee while skimming close to the magnetic equator
C/NOFS Satellite MissionSCINDA - Satellite Comparison 13 January 2010 23:10:54 UT Densities 1 s Resolution Power at Fresnel scale Density Variations PowerSpectral Density Spectral intensity is high at the Fresnel scale (~850 m) inside all depletions.
C/NOFS Satellite MissionSCINDA - Satellite Comparison Comparison of VEFI and PLP Observations14 January 2010 Orbit 9464 .75 km 7.50 km 75 km 10. 1.0 0.1 B3AC Freq. Hz Fresnel Scale .75 km 7.50 km 75 km 10. 1.0 0.1 E34 Freq. Hz 0200 0230 0300 UT VEFI measurements of low frequency AC fields (top) compared with FFT of 512 Hz PLP data
C/NOFS Satellite MissionSCINDA - Satellite Comparison 13 January 2010 23:11:51 UT Fs Fs Fs VEFI measures quasi DC E-fields 1024 s-1 that are reported 16 s-1. - Low pass AC fields < 6 Hz. - High pass AC fields 3 to 8,000 Hz (burst data) - Fresnel scale of 850 m corresponds to a frequency of ~ 8 Hz. Both plasma densities and AC electric fields show significant power at and near the Fresnel scale.
C/NOFS Satellite MissionSCINDA-Satellite Comparison 14 January 2010 Orbit 9464 02:18:56 UT PLP and IVM Measurements Altitude Density Darkness Mag. Equator Orbit IVM measurements indicate local depletions moving downward with respect to plasma on adjacent flux tubes. C/NOFS perigee north of the magnetic equator
Equatorial Electrodynamics 14 January 2010 02:35:48 UT Densities 1 s Resolution Fresnel Scale Power Density Variations Power Spectral Density Spectral intensity at Fresnel scale was high inside depleted flux tubes but decreased sharply as C/NOFS crossed eastern walls.
Equatorial Electrodynamics 14 January 2010 Orbit 9466 05:32:46 UT PLP and IVM Measurements Altitude Density Darkness Mag. Equator Orbit • IVM data indicate local density enhancements moving upward with respect to plasma in nearby flux tubes. • Scintillations at Ancon relatively weak, S4 0.4 AT 05:48 UT. C/NOFS near perigee, north of the magnetic equator
C/NOFS Satellite MissionSCINDA - Satellite Comparison Densities: 1 s Resolution Fresnel Scale Power Density Variations Power Spectral Density Spectral intensity at Fresnel scale relatively high within upward moving density enhancement.
C/NOFS Satellite MissionSCINDA - Satellite Comparison Modeling Considerations Consider magnetic field as an Earth-centered dipole e- H+ O+ Mol+ Altitude (km) Irregularities C/NOFS observes at the magnetic equator near perigee map to +/- 7° at the peak of the F layer (~ 300 km in solar minimum). Density (cm-3)
C/NOFS Satellite MissionSCINDA - Satellite Comparison Transmission Line Modeling Considerations dB VA B0 Unperturbed Bottomside dV jg = ni M (g B)/B2 magnetic equator Perturbed Bottomside dE B0 jg = ni M (g B)/B2
C/NOFS Satellite Mission Tentative Conclusions • Haerendel (1972) argued that the R-T instability responsible for spread F and EPBs involves whole flux tubes rather than just local plasma irregularities. - Since the seeding irregularities are probably confined in space, we need to ask: How information propagates to tell topside plasma that the bottom irregularities want to change their initially unstable equilibrium configuration? • - Alfvén waves are required to transmit energy to topside plasma and maintain field • lines near equipotential values (E ≈ E) in regions remote from R-T growth. • A subset of C/NOFS data are consistent with purely topside irregularities, (i.e. not EPBs) created via polarization E-fields that map to the topside. • - Consistent with Alfvén hypothesis, VEFI detected both E and B perturbations. - Further investigation needed to ascertain role of B and the relationship between E/ B and VA = B0/(0ρ)½ • If correct, then satellites flying in low-inclination orbits in the lower reaches • of the topside ionosphere can remotely sense the presence of scintillation- causing irregularities at conjugate bottomside altitudes through measurements of n, E and/or B irregularity spectra.