Download

1 / 33
330 likes | 402 Views
Congestion Control . Theory and IEEE Standardization. Final Project Network Simulation Modeling. Presented by: Denis Surkes ID 321416505 Ran Levy ID 36679215. QCN ( Q uantitazed C ongestion N otification).

E N D
Congestion Control Theory and IEEE Standardization
Final Project Network Simulation Modeling Presented by: Denis Surkes ID 321416505 Ran Levy ID 36679215
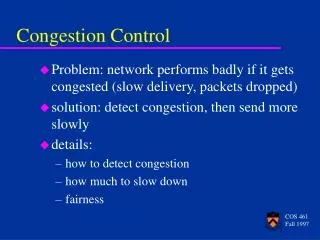
QCN (QuantitazedCongestion Notification) • The QCN Algorithm has been developed to provide congestion control at the Ethernet layer, or at L2. • The algorithm issues a pause message to upstream buffers, when the buffer at a congested link fills up. • This action ensures packets do not get dropped due to congestion.
The CP Algorithm • Calculate Fb (feedback value that indicate the level of congestion) for each income frame Fb = (Qeq-Qlen) – w*(Qlen-Qlen_old) • If Fb<0 send a congestion message back with quantized Fb value
The RP Algorithm Two counters: byte-counter and timer Both reset by Fb < 0 signal Byte-Counter • 5 cycles of FR (150KB/cycle) • AI cycles afterwards (75KB/cycle) Timer • 5 cycles of FR (TIMER_PERIOD msec/cycle) • AI cycles afterwards (TIMER_PERIOD/2 msec/cycle) RL 3 states – Fast recovery Active increase hyperActive increase
Simulation Goal • Analyze a network with high dataRates, and a congested links. • Activate the QCN algoritm in such a network and analayze the RTT times and stabilty of the network • Compare the behavior of congested link with and without the QCN algorithm. • Compare several parameters in the QCN algorithm itself.
Implementation description Network Topology
Switch To Host Out[2] In[2] Out[0] CP CP In[0] To Host Message Controller In[4] CP Out[4] To Host To Switch In[1] CP CP Out[1] Out[3] In[3] To Host
Switch Description • Manage Controller – control flow of income packets from input to CP and feedback Messages from CP to output • Manage switch routing table that configured through switch configuration file • CP (Congestion Point) - simulate output buffer and apply CP algorithm to all income packets
Host Description • RP algrotihm is implemented here • Creating the packets according to current Rate by changing the datarate channel. • Distributing the packets: • Uniformly • Always sends through bottle neck • Calculates RTT
Assumptions • Switch is ideal, i.e routing the packets don’t take time and routing tables are already configured. • No delay and errors on channels • Host doesn’t create packets faster than the current rate. • Packets are normal distributed (1000,200) • Feedback messages have priority over regular messages.
QCN Off Preventing the switch from sending feedback messages
QCN off Queue length Host datarate Queue length: Mean: 299.59290915772 Stddev: 3.0531562271108 Max: 300.0 Packets loss: 3696354
QCN On Feedback messages generated to prevent queue overload and packets lost.
Queue length on switch Mean: 60.27619 Stddev: 1.5215605
dataRates hosts 0-3 Mean: 2.72004*10^9 Stddev: 9.306672*10^7 Mean: 2.3249501*10^9 Stddev: 1.1768111*10^8 Mean: 2.5859536*10^9 Stddev: 7.528326*10^7 Mean: 2.3903864*10^9 Stddev: 1.5451428*10^8
Feedback count Mean: 34.05208 Stddev: 4.104861
Uniform distribution Hosts - sends packets uniformly
Queue Length, Histogram Mean 33.4116 Stddev 24.4033
Feedback counter interval 1ms Mean 30.8372 Stddev 11.8787
RTT Mean 3.92304e-05 Stddev 3.63771e-05 Max 0.000488596
DataRate hosts 0-3 Mean:4.361909*10^9 Mean: 4.43117*10^9 Stddev: 4.917516*10^8 Stddev: 4.841612*10^8 Mean: 4.6436*10^9Mean: 4.14858*10^9 Stddev: 3.271976*10^8Stddev: 2.638262*10^8
Short timer Hosts- sends to bottlneck Timer- set to 1ms
Queue length Mean 60.9034 Stddev11.8053
Datarate host0-3 Mean: 2.72934*10^9 Mean: 2.399835*10^9 Stddev: 2.79716*10^8 Stddev: 2.22185*10^8 Mean: 2.541936*10^9 Mean: 2.392924*10^9 Stddev: 1.45063*10^8Stddev: 1.01734*10^8
Feedback counter Mean 40.1959 Stddev16.0076
RTT Mean 0.000108274 Stddev 1.45964e-05
Conclutions The QCN algorithm is essential in data centers because it allows the ability to transfer huge amounts of data without any loss of packets When QCN is active there is almost no reduction In RTT. Congested link is fully optimized while maintaining fairness to all hosts.