Download
1 / 21
210 likes | 213 Views
Trait Selection When Culling U.S. Holsteins. H.D. Norman, J.L. Hutchison, J.R. Wright, and M.T. Kuhn Animal Improvement Programs Laboratory http://aipl.arsusda.gov Agricultural Research Service, USDA, Beltsville, MD, USA dnorman@aipl.arsusda.gov 301-504-8334. Changes in trait selection.

E N D
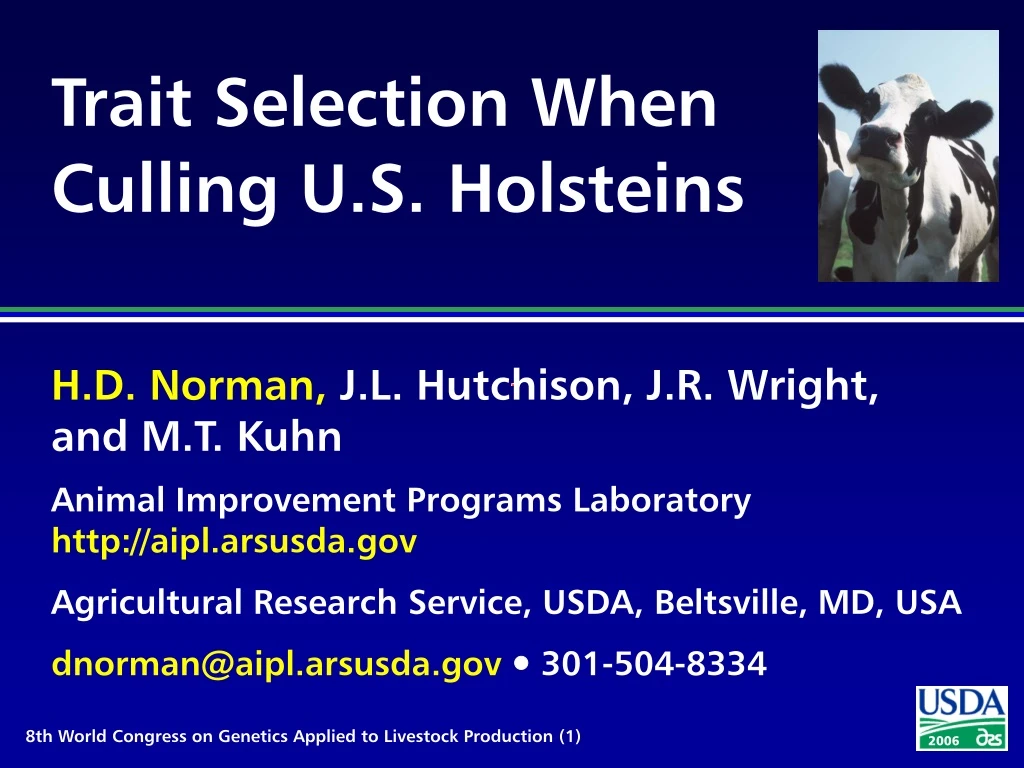
Trait Selection WhenCulling U.S. Holsteins H.D. Norman, J.L. Hutchison, J.R. Wright, and M.T. Kuhn Animal Improvement Programs Laboratory http://aipl.arsusda.gov Agricultural Research Service, USDA, Beltsville, MD, USA dnorman@aipl.arsusda.gov 301-504-8334
Changes in trait selection • More traits available for selection • Assignment of economic weights in genetic indexes • Economic information on benefits and costs associated with traits • Estimation of phenotypic and genetic relationships among traits
Objectives • Determine emphasis currently placed on different yield and fitness traits when culling during the first 3 parities • Document trends in trait emphasis when culling over the last 20 years
Data • Yield (milk, fat, true protein), somatic cell score, days open, dystocia score, and conformation records • U.S. Holsteins that 1st calved between January 1982 and October 2000 by 36 months of age • Dairy Herd Improvement herds on test for 1600 days after cow’s 1st calving date • Identified sires • Calving intervals of 270 to 650 days
Models • Yield and somatic cell score Y = H + S + e • Days open and dystocia score Y = A + C + H + S + e • Final score and linear type traits Y = A + D + H + S + e Y = trait A = age group H = herd-calving season C = calendar month S = survival group D = lactation stage e = residual
Defining survival groups • 1st-parity analysis • Cows with 1st parity only • Cows with 1st and 2nd parities only • Cows with 1st, 2nd, and 3rd parities only • Cows with 4 parities or more • Alternate 1st-parity analysis • Cows with 1st parity only • Cows with 2 parities or more
Defining survival groups • 2nd-parity analysis • Cows with 1st and 2nd parities only • Cows with 3 parities or more • 3rd-parity analysis • Cows with 1st, 2nd, and 3rd parities only • Cows with 4 parities or more
Differences in 1st-parity milk yield (kg) by survival group Differences in 1st-parity milk yield (kg) by survival group
Differences in 1st-parity somatic cell score by survival group
Results for other parities • 2nd-parity differences within 15% of 1st-parity differences except for days open and dystocia score • Less difference in survivor advantage for days open over time compared with 1st parity • Differences for dystocia score about half those for 1st parity • 3rd-parity differences similar to those for 1st and 2nd parities
Trait emphases*(%) during 1st-lactation culling *Relative to 100% for milk yield (on standardized trait basis)
Conformation trait emphases during 1st-lactation culling • Relative to 100% for final score • Body traits received more emphasis during 1980s (22 to 32%) than during recent years (1 to 20%) • Udder trait emphasis has remained consistent (40 to 64%) • Emphasis on udder depth had greatest increase (from 13 to 41%) • Emphasis on feet and legs increased slightly • Emphasis on dairy form decreased (from 50 to 23%)
Trait emphases*(%) during 2nd-lactation culling *Relative to 100% for milk yield (on standardized trait basis)
Trait emphases*(%) during 3rd-lactation culling *Relative to 100% for milk yield (on standardized trait basis)
Conclusions • Relative emphasis among traits when culling has remained reasonably consistent since 1982 regardless of parity • Protein yield received nearly the same emphasis as milk yield • Emphasis on fat yield was slightly lower than on milk yield (72 to 91%)
Conclusions • Increased emphasis being placed on lower somatic cell score in later parities • Culling emphasis on days open has increased, and clearly more given for later parities • Culling emphasis on dystocia score was low relative to milk yield (7 to 19%) • Emphasis on final score when culling was low relative to milk yield (22 to 38%)
Application Knowledge from this study could be useful for: • Selection by artificial-insemination organizations of bulls to progeny test or to retain in active service consistent with trait priority of dairy producers • Development of culling-decision software with index-style culling guide • Optimal genetic gains at minimal cost
Acknowlegments • Tom Lawlor, Holstein Association USA, for providing Holstein conformation data.