Download
1 / 42
420 likes | 536 Views
Analysis of Social Media. Trend Analysis Mohit Kumar Oct 31, 2007. Roadmap. The Predictive Power of Online Chatter – Gruhl et al, KDD’05 Topics over Time: A Non-Markov Continuous-Time Model of Topical Trends – Wand and McCallum, KDD’06 Briefly:

E N D
Analysis of Social Media Trend Analysis Mohit Kumar Oct 31, 2007
Roadmap • The Predictive Power of Online Chatter – Gruhl et al, KDD’05 • Topics over Time: A Non-Markov Continuous-Time Model of Topical Trends – Wand and McCallum, KDD’06 • Briefly: • Visualizing Tags over Time – Dubinko et al, WWW’06
The Predictive Power of Online Chatter – KDD’05 Daniel Gruhl IBM Almaden Research Center R. Guha Google, Inc Ravi Kumar IBM Almaden Research Center Jasmine Novak IBM Almaden Research Center Andrew Tomkins IBM Almaden Research Center (now Yahoo!)
Motivation • Demonstration of link between online content (blogs) and customer behavior (purchase decision) • Predict spikes in sales rank based on online chatter
Domain • Sales rank of books on Amazon.com • Postings in blogs, media and webpages
Findings • Hand-crafted queries produce matching posts whose volume predict sales rank • These queries can be automatically generated • Successfully predict spikes in sales rank (not general sales rank motion)
Causation • Bloggers are most likely non-causative indicators of other root-cause (typically an event in the outside world) • Possible explanations for delay between postings and changes in sales rank, linked to profiling of bloggers: • Forward thinking people who write and buy early but represent only a small fraction of population • Representative of the population but threshold to write about a product may be lower than buying the product
Data Details • IBM Web Fountain • 300K blogs • 200K postings per day • 3B web pages • 200K media articles per day (Factiva media feed) • Amazon sales rank data • 2430 books • 480K sales rank readings • Duration – 120 days
Correlation between Sales Rank and Blog Mentions • Spike: All the ranks that do not occur within a week of the minimum rank are “large enough” • Large enough ~ max(m+50,1.5m) • 50 books contains ‘spikes’ during the considered time interval of study
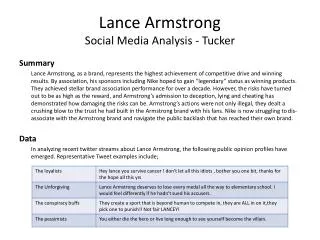
Example 1 • Spike corresponds to Armstrong winning Tour de France on July 25th Query: Lance Armstrong OR Tour de France
Example 2 • Two plausible factors: • Message board corresponding to a TV show starting taking style questions • Authors had another book release Query: What not to wear
Example 3 • Spike coincides with movie released on Sep 1 Query: Vanity Fair OR William Thackeray
Cross correlation • Query: Lance Armstrong OR Tour de France • Leading Best Lag • Query: What not to wear • Leading Best Lag • Query: Vanity Fair OR William Thackeray • Slightly Trailing Best Lag • Out of 50 books with spikes, 10 have highly correlated blog mentions
Factors affecting sales rank but not Blog mentions • Marketing promotions • Book release (filtered out books released in 2004 from their dataset) • Wholesale purchase • Lower ranking books get spikes but not public attention
Separate Example - Trend • High point following the release of the film – Jun 28’04 • Steadily falling Query: The Notebook AND Nicholas Sparks
Findings • Hand-crafted queries produce matching posts whose volume predict sales rank • These queries can be automatically generated • Successfully predict spikes in sales rank (not general sales rank motion)
Automatically generated query • Query generation based on author name • Fairly simple • Needs more exploration Query: Buster Olney
Automatically generated query Scatter plot of cross-correlation versus lag for 182 automatically-generated queries.
Findings • Hand-crafted queries produce matching posts whose volume predict sales rank • These queries can be automatically generated • Successfully predict spikes in sales rank (not general sales rank motion)
Problem statement • Given • Time series representing sales rank upto time t • Is • Addition of blog mention data • Helpful in predicting • Sales rank future trend?
Predicting Motion (Sales up or down) • 2-class classification problem • Natural predictors • Moving averages • 63 % accuracy – best classfier • Least squares predictors • 60 % accuracy – best classifier • Markov predictor • 63% accuracy • Not explicitly mentioned how the Blog mention data is used
Predicting Volatility (difference in sales by a threshold) • Threshold chosen to indicate volatility – 44 • 72% accuracy – Best classifier • Not explicitly mentioned how the Blog mention data is used
Predicting Spikes • Create labeled data for evaluation • Tag spikes • Problem: • Given: Product, time t, blog mentions • Output: spike in near future (binary classification)
Predicting Spikes – Heuristic Algorithm • Three principles for finding spikes: • Biggest ever • Exceed historical averages significantly • Rise relatively quickly • Translates into a function with 3 linear equations
Evaluation • Not treated as binary classification at time instance • Treated as predicting Leading & Trailing predictions (2 week window) • Fairly weak/complicated evaluation • 2/3 of the predictions made have Leading/Trailing predictions so may be an accuracy of 66% • Recall ~ 0.5
Conclusion • Online chatter ‘may’ represent early indicator of real-world behavior
Critique • Preliminary work in exploring a significant/important problem • Good roadmap for future research by decomposing the problem as follows: • Get ‘relevant’ blog mentions • Correlate mentions with sales rank
Topics over Time: A Non-Markov Continuous-Time Model of Topical Trends KDD’06 Xuerui Wand U.Mass, Amherst Andrew McCallum U.Mass, Amherst Acknowledgement: Slides borrowed from Linda Buisman, Australian National University
Motivation • Information retrieval & text mining • Text is highly-dimensional • Topic models • Discover summaries of documents • Reduce dimensions • Model co-occurrences of words • mouse, cat, Tweety -> cartoons • mouse, keyboard -> computer supplies • Topics over time • Co-occurrences are dynamic • Additional modality – time • united, states, war @ 1850 -> Mexican-American War • united, states, war @ 1918 -> World War I • united, states, war @ 2006 -> War in Iraq
Modeling time • Earlier approaches • Discretize • Fixed interval size does not fit all topics • Markov model • State at time t+1 depends on t, but not earlier • Solution • Treat time as a continuous variable • Time is a parameter in a Bayesian network
Bayesian network • Generative model • vs discriminative (SVM, NN, …) • Bayes’ rule: • Bayesian network • Directed graph of parameters • A connected to B: • Probability of B conditionally depends on A • Generation step • Estimate conditional probabilities for all (hidden) parameters • Goal • Predict probability of hypothesis H being true for observation X
Topics-over-time model • Based on an earlier topic model LDA • “Bag-of-words” approach • Word count in a document is significant • Position and order are not significant • Timestamp of document becomes another parameter • Generate Bayesian network from existing documents • Exact inference computationally infeasible • Use approximate inference • Goal • Predict the probability of a document belonging to topic T
Results Distribution of topic over time Words associated with a topic
Comparison with LDA TOT LDA Confuses Panama Canal with other activites in Central America Confuses Mexican war with WWI
KL Divergence between topics TOT topics are more distinct from each other
Time Prediction Task: predict the decade given the text of the SoU Address
Topic Distribution Profile Emphasis on SVMs, Optimization, Probability and Inference Emphasis on Neural networks, analog circuits and cells NIPS dataset
Topic Co-occurrences over time Co-occurrence of topics with the “classification’ topic in NIPS dataset
Analysis • Generative vs discriminative methods • Discriminative usually faster • Accuracy depends on application • Generative model offers more information • E.g. not just topic(s) of a document, but also: • Predict time-stamp, given a document • Distribution of topics over time
Analysis (cont) • Limitations and simplifications • “Bag-of-words” instead of word sequences or phrases • Computer science vs computer, science • No account of position within document • Title, introduction, body, footnote