Download
1 / 106
1.06k likes | 1.16k Views
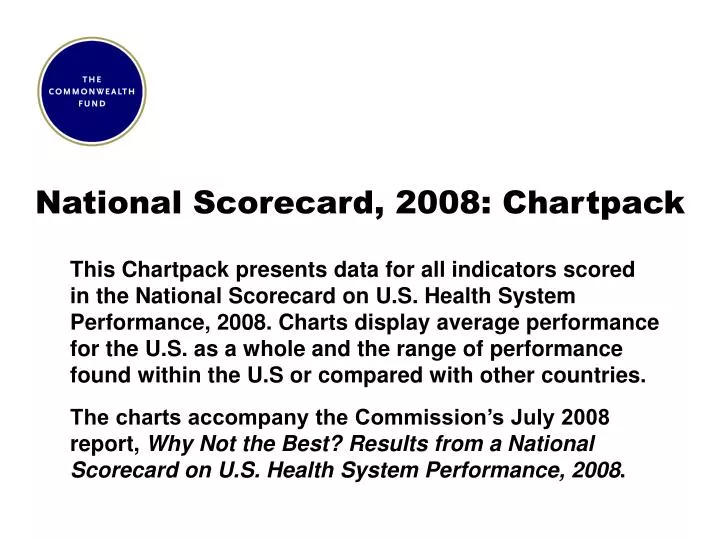
National Scorecard, 2008: Chartpack.

E N D
National Scorecard, 2008: Chartpack This Chartpack presents data for all indicators scoredin the National Scorecard on U.S. Health System Performance, 2008. Charts display average performance for the U.S. as a whole and the range of performance found within the U.S or compared with other countries. The charts accompany the Commission’s July 2008 report, Why Not the Best? Results from a National Scorecard on U.S. Health System Performance, 2008.
2 Source: Commonwealth Fund National Scorecard on U.S. Health System Performance, 2008 Scores: Dimensions of a High Performance Health System
HEALTHY LIVES 3 Source: Commonwealth Fund National Scorecard on U.S. Health System Performance, 2008 SECTION 1. HEALTHY LIVES Scored Indicators: • Mortality amenable to health care • Infant mortality rate • Healthy life expectancy at age 60* • Adults under 65 limited in any activities because of health problems • Children who missed 11 or more days of school due to illness or injury* * Indicator was not updated due to lack of data. Baseline figures from 2006 Scorecard are presented.
HEALTHY LIVES 4 Source: Commonwealth Fund National Scorecard on U.S. Health System Performance, 2008 Mortality Amenable to Health Care Deaths per 100,000 population* * Countries’ age-standardized death rates before age 75; including ischemic heart disease, diabetes, stroke, and bacterial infections. See report Appendix B for list of all conditions considered amenable to health care in the analysis. Data: E. Nolte and C. M. McKee, London School of Hygiene and Tropical Medicine analysis of World Health Organization mortality files (Nolte and McKee 2008).
HEALTHY LIVES 5 Source: Commonwealth Fund National Scorecard on U.S. Health System Performance, 2008 Infant Mortality Rate Infant deaths per 1,000 live births National Average and State Distribution International Comparison, 2004 ^ Denotes baseline year. Data: National and state—National Vital Statistics System, Linked Birth and Infant Death Data (AHRQ 2003, 2004, 2005, 2006, 2007a); international comparison—OECD Health Data 2007, Version 10/2007.
HEALTHY LIVES 6 Source: Commonwealth Fund National Scorecard on U.S. Health System Performance, 2008 Healthy Life Expectancy at Age 60, 2002 Developed by the World Health Organization, healthy life expectancy is based on life expectancy adjusted for time spent in poor health due to disease and/or injury Years Note: Indicator was not updated due to lack of data. Baseline figures are presented. Data: The World Health Report 2003 (WHO 2003, Annex Table 4).
HEALTHY LIVES 7 Source: Commonwealth Fund National Scorecard on U.S. Health System Performance, 2008 Working-Age Adults with Health Limits on Activities or Work Percent of adults (ages 18–64) limited in any activities because of physical, mental, or emotional problems National Average and State Distribution By Age Group Data: D. Belloff, Rutgers Center for State Health Policy analysis of Behavioral Risk Factor Surveillance System. 7
HEALTHY LIVES 8 Source: Commonwealth Fund National Scorecard on U.S. Health System Performance, 2008 School Absences Due to Illness or Injury, by Top and Bottom States, Race/Ethnicity, Family Income, and Insurance, 2003 Percent of children (ages 6–17) who missed 11 or more school days due to illness or injury during past year Note: Indicator was not updated due to lack of data. Baseline figures from Scorecard 2006 are presented. Data: 2003 National Survey of Children’s Health (HRSA 2005; retrieved from Data Resource Center for Child and AdolescentHealth database at http://www.nschdata.org).
QUALITY 9 Source: Commonwealth Fund National Scorecard on U.S. Health System Performance, 2008 SECTION 2. QUALITY Quality includes indicators organized into four groups: • Effective care • Coordinated care • Safe care • Patient-centered, timely care The Scorecard scores each group of indicators separately, and then averages the four scores to create the overall score for Quality.
QUALITY: EFFECTIVE CARE 10 Source: Commonwealth Fund National Scorecard on U.S. Health System Performance, 2008 Effective Care Scored Indicators: • Adults received recommended screening and preventive care • Children received recommended immunizations and preventive care • Received all recommended doses of five key vaccines • Received both medical and dental preventive care visits* • Needed mental health care and received treatment • Adults • Children* • Chronic disease under control • Adults with diabetes whose HbA1c level <9% • Adults with hypertension whose blood pressure <140/90 mmHg • Hospitalized patients receive recommended care for heart attack, heart failure, and pneumonia * Indicator was not updated due to lack of data. Baseline figures from 2006 Scorecard are presented.
QUALITY: EFFECTIVE CARE 11 Source: Commonwealth Fund National Scorecard on U.S. Health System Performance, 2008 Receipt of Recommended Screening and Preventive Care for Adults Percent of adults (ages 18+) who received all recommended screening and preventive care within a specific time frame given their age and sex* U.S. Average U.S. Variation 2005 * Recommended care includes seven key screening and preventive services: blood pressure, cholesterol, Pap, mammogram,fecal occult blood test or sigmoidoscopy/colonoscopy, and flu shot. See report Appendix B for complete description. Data: B. Mahato, Columbia University analysis of Medical Expenditure Panel Survey.
QUALITY: EFFECTIVE CARE 12 Source: Commonwealth Fund National Scorecard on U.S. Health System Performance, 2008 Immunizations for Young Children Percent of children (ages 19–35 months) who received all recommended doses of five key vaccines* National Average and State Distribution By Family Income, Insurance Status**, and Race/Ethnicity, 2006 ^ Denotes baseline year. * Recommended vaccines include: 4 doses of diphtheria-tetanus-pertussis (DTP), 3+ doses of polio, 1+ dose of measles-mumps-rubella, 3+doses of Haemophilus influenzae type B, and 3+ doses of hepatitis B vaccine. **Data by insurance was from 2003. Data: National Immunization Survey (NCHS National Immunization Program, Allred 2007).
QUALITY: EFFECTIVE CARE 13 Source: Commonwealth Fund National Scorecard on U.S. Health System Performance, 2008 Preventive Care Visits for Children, by Top and Bottom States, Race/Ethnicity, Family Income, and Insurance, 2003 Percent of children (ages <18) who received BOTH a medical and dental preventive care visit in past year Note: Indicator was not updated due to lack of data. Baseline figures from 2006 Scorecard are presented. Data: 2003 National Survey of Children’s Health (HRSA 2005; retrieved from Data Resource Center for Child and AdolescentHealth database at http://www.nschdata.org).
QUALITY: EFFECTIVE CARE 14 Source: Commonwealth Fund National Scorecard on U.S. Health System Performance, 2008 Adults with Major Depressive Episode Who Received Treatment Percent of adults (ages 18+) with major depressive episode who received treatment in the past year* U.S. Average U.S. Variation 2006 Note: Indicator definition has been modified from 2006 Scorecard. *Major depressive episode is defined as a period of at least 2 weeks when a person experienced a depressed mood or loss of interest or pleasure in daily activities and had a majority of the symptoms for depression. **Medicare includes other insurance such as military and veterans health care. Data: National Survey on Drug Use and Health (SAMHSA 2006 and 2007).
QUALITY: EFFECTIVE CARE 15 Source: Commonwealth Fund National Scorecard on U.S. Health System Performance, 2008 Mental Health Care for Children, by Top and Bottom States, Race/Ethnicity, Family Income, and Insurance, 2003 Percent of children (ages <18) who needed and received mental health care in past year* Note: Indicator was not updated due to lack of data. Baseline figures are presented. * Children with current emotional, developmental, or behavioral health condition requiring treatment or counseling who received needed care during the year. Data: 2003 National Survey of Children’s Health (HRSA 2005; Retrieved from Data Resource Center for Child and Adolescent Health database at http://www.nschdata.org).
QUALITY: EFFECTIVE CARE 16 Source: Commonwealth Fund National Scorecard on U.S. Health System Performance, 2008 Chronic Disease Under Control: Diabetes and Hypertension National Average By Insurance, 1999-2004 Percent of adults (age 18+) *Refers to diabetic adults whose HbA1c is <9.0 **Refers to hypertensive adults whose blood pressure is <140/90 mmHg. Data: J. M. McWilliams, Harvard Medical School analysis of National Health and Nutrition Examination Survey.
QUALITY: EFFECTIVE CARE 17 Source: Commonwealth Fund National Scorecard on U.S. Health System Performance, 2008 Chronic Disease Under Control: Managed Care Plan Distribution, 2006 Diabetes Hypertension Percent of adults with diagnosed diabetes whose HbA1c level <9.0% Percent of adults with hypertension whose blood pressure <140/90 mmHg Note: Diabetes includes ages 18–75; hypertension includes ages 18–85. Data: Healthcare Effectiveness Data and Information Set (NCQA 2007).
QUALITY: EFFECTIVE CARE 18 Source: Commonwealth Fund National Scorecard on U.S. Health System Performance, 2008 Hospitals: Quality of Care for Heart Attack, Heart Failure, and Pneumonia Overall Composite for All Three Conditions Individual Composites by Condition, 2006 Percent of patients who received recommended care for all three conditions* Percent of patients who received recommended care for each condition* * Composite for heart attack care consists of 5 indicators; heart failure care, 2 indicators; and pneumonia care, 3 indicators.Overall composite consists of all 10 clinical indicators. See report Appendix B for description of clinical indicators. Data: A. Jha and A. Epstein, Harvard School of Public Health analysis of data from CMS Hospital Compare.
QUALITY: EFFECTIVE CARE 19 Source: Commonwealth Fund National Scorecard on U.S. Health System Performance, 2008 Hospital Quality of Care for Heart Attack, Heart Failure, and Pneumonia: Overall Composite Using Expanded Set of 19 Clinical Indicators*, 2006 Percent of patients who received recommended care for all three conditions Hospitals States *Consists of original 10 "starter set" indicators and 9 new indicators for which data was made available as of December 2006; heart attack care includes 3 new indicators; heart failure care, 2 new indicators; and pneumonia, 4 new indicators) Data: A. Jha and A. Epstein, Harvard School of Public Health analysis of data from CMS Hospital Compare.
QUALITY: EFFECTIVE CARE 20 Source: Commonwealth Fund National Scorecard on U.S. Health System Performance, 2008 Hospital Quality of Care by Condition: Composites for Heart Attack, Heart Failure, and Pneumonia *Consists of original "starter set" indicators and new indicators for which data was made available as of December 2006. Data: A. Jha and A. Epstein, Harvard School of Public Health analysis of data from CMS Hospital Compare. 20
QUALITY: COORDINATED CARE 21 Source: Commonwealth Fund National Scorecard on U.S. Health System Performance, 2008 Coordinated Care Scored Indicators: • Adults under 65 with an accessible primary care provider • Children with a medical home* • Care coordination at hospital discharge • Hospitalized patients with new Rx: Medications were reviewedat discharge* • Heart failure patients received written instructions at discharge • Follow-up within 30 days after hospitalization for mental health disorder • Nursing homes: hospital admissions and readmissions • Home health: hospital admissions * Indicator was not updated due to lack of data. Baseline figures from 2006 Scorecard are presented.
QUALITY: COORDINATED CARE 22 Source: Commonwealth Fund National Scorecard on U.S. Health System Performance, 2008 Adults with an Accessible Primary Care Provider Percent of adults ages 19–64 with an accessible primary care provider* U.S. Average U.S. Variation 2005 * An accessible primary care provider is defined as a usual source of care who provides preventive care, care for new and ongoing health problems, referrals, and who is easy to get to. Data: B. Mahato, Columbia University analysis of Medical Expenditure Panel Survey.
QUALITY: COORDINATED CARE 23 Source: Commonwealth Fund National Scorecard on U.S. Health System Performance, 2008 Children with a Medical Home, by Top and Bottom States, Race/Ethnicity, Family Income, and Insurance, 2003 Percent of children who have a personal doctor or nurse and receive care that is accessible, comprehensive, culturally sensitive, and coordinated* Note: Indicator was not updated due to lack of data. Baseline figures are presented. * Child had 1+ preventive visit in past year; access to specialty care; personal doctor/nurse who usually/always spent enoughtime and communicated clearly, provided telephone advice or urgent care and followed up after the child’s specialty care visits. Data: 2003 National Survey of Children’s Health (HRSA 2005; retrieved from Data Resource Center for Child and AdolescentHealth database at http://www.nschdata.org).
QUALITY: COORDINATED CARE 24 Source: Commonwealth Fund National Scorecard on U.S. Health System Performance, 2008 Medications Reviewed When Discharged from the Hospital,Among Sicker Adults, 2005 Percent of hospitalized patients with new prescription who reported prior medications were reviewed at discharge Note: Indicator was not updated due to lack of data. Baseline figures from Scorecard 2006 are presented. AUS=Australia; CAN=Canada; GER=Germany; NZ=New Zealand; UK=United Kingdom; US=United States. Data: 2005 Commonwealth Fund International Health Policy Survey.
QUALITY: COORDINATED CARE 25 Source: Commonwealth Fund National Scorecard on U.S. Health System Performance, 2008 Heart Failure Patients Given Complete Written Instructions When Discharged, by Hospitals and States Percent of heart failure patients discharged home with written instructions* Hospitals States * Discharge instructions must address all of the following: activity level, diet, discharge medications, follow-up appointment, weight monitoring, and what to do if symptoms worsen. Data: A. Jha and A. Epstein, Harvard School of Public Health analysis of data from CMS Hospital Compare; State 2004 distribution —Retrieved from CMS Hospital Compare database at http://www.hospitalcompare.hhs.gov.
QUALITY: COORDINATED CARE 26 Source: Commonwealth Fund National Scorecard on U.S. Health System Performance, 2008 Managed Care Health Plans: 30-Day Follow-Up After Hospitalization for Mental Illness Percent of health plan members (ages >6) who received inpatient treatment for a mental health disorder and had follow-up within 30 days after hospital discharge Managed Care Plans (2006) Annual averages * Denotes baseline year. Data: Healthcare Effectiveness Data and Information Set (NCQA 2007).
QUALITY: COORDINATED CARE 27 Source: Commonwealth Fund National Scorecard on U.S. Health System Performance, 2008 Nursing Homes: Hospital Admission and Readmission RatesAmong Nursing Home Residents Percent of short-stay residents re-hospitalized within 30 days of hospital discharge to nursing home Percent of long-stay residents with a hospital admission Data: V. Mor, Brown University analysis of Medicare enrollment data and Part A claims data for all Medicare beneficiaries who entered a nursing home and had a Minimum Data Set assessment during 2000 and 2004.
QUALITY: COORDINATED CARE 28 Source: Commonwealth Fund National Scorecard on U.S. Health System Performance, 2008 Home Health Care: Hospital Admissions Percent of home health care patients who had to be admitted to the hospital Home Health Agencies States ^ 2003 data for state estimates. Data: Outcome and Assessment Information Set (Retrieved from CMS Home Health Compare database at http://www.medicare.gov/HHCompare, Pace et al. 2005)
QUALITY: SAFE CARE 29 Source: Commonwealth Fund National Scorecard on U.S. Health System Performance, 2008 Safe Care Scored Indicators: • Patients reported medical, medication, or lab test error • Unsafe drug use • Ambulatory care visits for treating adverse drug effects • Children prescribed antibiotics for throat infection withouta “strep” test • Elderly used 1 of 33 inappropriate drugs • Nursing home residents with pressure sores • Hospital-standardized mortality ratios Other Indicators: • Surgical infection prevention • Adverse events and complications of care in hospitals
QUALITY: SAFE CARE 30 Source: Commonwealth Fund National Scorecard on U.S. Health System Performance, 2008 EXHIBIT 16 Medical, Medication, and Lab Errors, Among Sicker Adults Percent reporting medical mistake, medication error, or lab error in past two years 2005 2007 United States International Comparison AUS=Australia; CAN=Canada; GER=Germany; NETH=Netherlands; NZ=New Zealand; UK=United Kingdom. Data: 2005 and 2007 Commonwealth Fund International Health Policy Survey.
QUALITY: SAFE CARE 31 Source: Commonwealth Fund National Scorecard on U.S. Health System Performance, 2008 Ambulatory Care Visits for Treating Adverse Drug Effects Visits per 1,000 population per year By Gender, Race, and Region, 2004 Annual Averages, by Care Setting * Denotes baseline year. Data: C. Zhan, AHRQ analysis of National Ambulatory Medical Care Survey and National Hospital Ambulatory Medical Care Survey.
QUALITY: SAFE CARE 32 Source: Commonwealth Fund National Scorecard on U.S. Health System Performance, 2008 Potentially Inappropriate Antibiotic Prescribingfor Children with Sore Throat Percent of children prescribed antibiotics for throat infection without receiving a “strep” test* National Average Managed Care Plan Distribution, 2006 Note: National average includes ages 3–17 and plan distribution includes ages 2–18. * A strep test means a rapid antigen test or throat culture for group A streptococcus. Data: National average—J. Linder, Brigham and Women's Hospital analysis of National Ambulatory Medical Care Survey and National Hospital Ambulatory Medical Care Survey; Plan distribution—Healthcare Effectiveness Data and Information Set (NCQA 2007). 32
QUALITY: SAFE CARE 33 Source: Commonwealth Fund National Scorecard on U.S. Health System Performance, 2008 Inappropriate Use of Medications by Elderly Percent of community-dwelling elderly adults (ages 65+) who reported taking at least 1 of 33 drugs that are potentially inappropriate for the elderly By Gender, Race/Ethnicity, and Region, 2004 National Average * Denotes baseline year. Data: Medical Expenditure Panel Survey (AHRQ 2007a).
QUALITY: SAFE CARE 34 Source: Commonwealth Fund National Scorecard on U.S. Health System Performance, 2008 Pressure Sores Among High-Risk and Short-Stay Residentsin Nursing Facilities Percent of nursing home residents with pressure sores Short-Stay Residents High-Risk Residents Data: Nursing Home Minimum Data Set (AHRQ 2005, 2007a).
QUALITY: SAFE CARE 35 Source: Commonwealth Fund National Scorecard on U.S. Health System Performance, 2008 Hospital-Standardized Mortality Ratios Standardized ratios compare actual to expected deaths, risk-adjusted for patient mix and community factors.* Medicare national average for 2000=100 Ratio of actual to expected deaths in each decile (x 100) mean Decile of hospitals ranked by actual to expected deaths ratios * See report Appendix B for methodology. Data: B. Jarman analysis of Medicare discharges from 2000 to 2002 and from 2004 to 2006 for conditions leading to 80 percent of all hospital deaths.
QUALITY: SAFE CARE 36 Source: Commonwealth Fund National Scorecard on U.S. Health System Performance, 2008 Surgical Infection Prevention, 2006 Percent of surgical patients who received appropriate timing of antibiotics to prevent infections* Hospitals States * Comprised of two indicators: antibiotics started within 1 hour before surgery and stopped 24 hours after surgery. Data: A. Jha and A. Epstein, Harvard School of Public Health analysis of data from CMS Hospital Compare.
QUALITY: SAFE CARE 37 Source: Commonwealth Fund National Scorecard on U.S. Health System Performance, 2008 Nosocomial Infections in Intensive Care Unit Patients, 2006 Data: Reported by 211 hospitals participating in the National Healthcare Safety Network (Edwards et al. 2007). 37
QUALITY: SAFE CARE 38 Source: Commonwealth Fund National Scorecard on U.S. Health System Performance, 2008 Potentially Preventable Adverse Events and Complicationsof Care in Hospitals, National and Medicare Trends * Rates exclude complications present on admission and are adjusted for gender, comorbidities,and diagnosis-related group clusters. ** National rate is for 1997, Medicare rate is for 1998. NA=data not available. Data: National figures—Healthcare Cost and Utilization Project, Nationwide Inpatient Sample (retrieved from HCUPNet at http://hcupnet.ahrq.gov); Medicare figures—MedPAC analysis of Medicare administrative data using AHRQ indicators and methods (MedPAC 2005, Chart 3-3 and 2007, Chart 4-2). 38
QUALITY: SAFE CARE 39 Source: Commonwealth Fund National Scorecard on U.S. Health System Performance, 2008 Potentially Preventable Adverse Events and Complicationsof Care in Hospitals Among Medicare Beneficiaries, 2004–2005 Percent *Surgical patients with postoperative pneumonia, urinary tract infection (2005 only), or venous thromboembolic event ** Patients with serious bleeding associated with intravenous heparin, low molecular weight heparin, or warfarin, or hypoglycemia associated with insulin or oral hypoglycemics. Data: M. Pineau, Qualidigm analysis of Medicare Patient Safety Monitoring System. 39
QUALITY: PATIENT-CENTERED, TIMELY CARE 40 Source: Commonwealth Fund National Scorecard on U.S. Health System Performance, 2008 Patient-Centered, Timely Care Scored Indicators: • Ability to see doctor on same/next day when sick or need medical attention • Very/somewhat easy to get care after hours without going to the emergency room • Doctor–patient communication: always listened, explained, showed respect, spent enough time • Adults with chronic conditions given self-management plan* • Patient-centered hospital care Other Indicator: • Physical restraints in nursing homes * Indicator was not updated due to lack of data. Baseline figures from 2006 Scorecard are presented.
QUALITY: PATIENT-CENTERED, TIMELY CARE 41 Source: Commonwealth Fund National Scorecard on U.S. Health System Performance, 2008 EXHIBIT 16 Waiting Time to See Doctor When Sick or Need Medical Attention, Among Sicker Adults Percent of adults who could get an appointment on the same or next day 2005 2007 United States International Comparison AUS=Australia; CAN=Canada; GER=Germany; NETH=Netherlands; NZ=New Zealand; UK=United Kingdom. Data: 2005 and 2007 Commonwealth Fund International Health Policy Survey.
QUALITY: PATIENT-CENTERED, TIMELY CARE 42 Source: Commonwealth Fund National Scorecard on U.S. Health System Performance, 2008 Difficulty Getting Care on Nights, Weekends, Holidays WithoutGoing to the Emergency Room, Among Sicker Adults Percent of adults who sought care reporting “very” or “somewhat” difficult 2005 2007 United States International Comparison AUS=Australia; CAN=Canada; GER=Germany; NETH=Netherlands; NZ=New Zealand; UK=United Kingdom. Data: 2005 and 2007 Commonwealth Fund International Health Policy Survey.
QUALITY: PATIENT-CENTERED, TIMELY CARE 43 Source: Commonwealth Fund National Scorecard on U.S. Health System Performance, 2008 Doctor–Patient Communication: Doctor Listened Carefully,Explained Things, Showed Respect, and Spent Enough Time,National and Managed Care Plan Type Percent of adults (ages 18+) reporting “always” Managed Care Plan Distribution, 2006 National Average * Denotes baseline year. **2005 data due to delays in the Medicare CAHPS survey. Data: National average—Medical Expenditure Panel Survey (AHRQ 2005, 2006, 2007a); Plan distribution—CAHPS (data provided by NCQA). 43
QUALITY: PATIENT-CENTERED, TIMELY CARE 44 Source: Commonwealth Fund National Scorecard on U.S. Health System Performance, 2008 Adults with Chronic Conditions: Receipt of Self-Management Plan, Among Sicker Adults, 2005 Percent of adults with chronic conditions* whose doctor gave plan to manage care at home Note: Indicator was not updated due to lack of data. Baseline figures are presented. * Adult reported at least one of six conditions: hypertension, heart disease, diabetes, arthritis, lung problems (asthma, emphysema, etc.), or depression. AUS=Australia; CAN=Canada; GER=Germany; NZ=New Zealand; UK=United Kingdom; US=United States. Data: 2005 Commonwealth Fund International Health Policy Survey.
QUALITY: PATIENT-CENTERED, TIMELY CARE 45 Source: Commonwealth Fund National Scorecard on U.S. Health System Performance, 2008 Patient-Centered Hospital Care: Staff Managed Pain, RespondedWhen Needed Help, and Explained Medicines, by Hospitals, 2007 Percent of patients reporting “always” * *** ** * Patient’s pain was well controlled and hospital staff did everything to help with pain. ** Patient got help as soon as wanted after patient pressed call button and in getting to the bathroom/using bedpan. *** Hospital staff told patient what medicine was for and described possible side effects in a way that patient could understand. Data: CAHPS Hospital Survey (Retrieved from CMS Hospital Compare database at http://www.hospitalcompare.hhs.gov). 45
QUALITY: PATIENT-CENTERED, TIMELY CARE 46 Source: Commonwealth Fund National Scorecard on U.S. Health System Performance, 2008 Physical Restraints in Nursing Facilities Percent of nursing home residents who were physically restrained National Average and State Distribution By Race/Ethnicity PI=Pacific Islander; AI/AN=American Indian or Alaskan Native. Data: Nursing Home Minimum Data Set (AHRQ 2004, 2005, 2006, 2007a).
ACCESS 47 Source: Commonwealth Fund National Scorecard on U.S. Health System Performance, 2008 SECTION 3. ACCESS Access includes indicators organized into two groups: • Participation • Affordability The Scorecard scores each group of indicators separately, and then averages the two scores to create the overall score for Access.
ACCESS: PARTICIPATION 48 Source: Commonwealth Fund National Scorecard on U.S. Health System Performance, 2008 Participation Scored Indicators: • Adults under 65 insured all year, not underinsured • Adults with no access problem due to costs Other Indicator: • Uninsured under 65: national and state trends
ACCESS: PARTICIPATION 72 68 42 35 27 17 49 Source: Commonwealth Fund National Scorecard on U.S. Health System Performance, 2008 Uninsured and Underinsured Adults, 2007 Compared with 2003 Percent of adults (ages 19–64) who are uninsured or underinsured Under 200% of poverty Total 200% of poverty or more * Underinsured defined as insured all year but experienced one of the following: medical expenses equaled 10% or more of income, or 5% or more of income if low-income (<200% of poverty); or deductibles equaled 5% or more of income. Data: 2003 and 2007 Commonwealth Fund Biennial Health Insurance Survey.
ACCESS: PARTICIPATION 50 Source: Commonwealth Fund National Scorecard on U.S. Health System Performance, 2008 EXHIBIT 16 Access Problems Because of Costs Percent of adults who had any of three access problems* in past year because of costs 2005 2007 United States International Comparison * Did not get medical care because of cost of doctor’s visit, skipped medical test, treatment, or follow-up because of cost, or did not fill Rx or skipped doses because of cost. AUS=Australia; CAN=Canada; GER=Germany; NETH=Netherlands; NZ=New Zealand; UK=United Kingdom. Data: 2005 and 2007 Commonwealth Fund International Health Policy Survey.