Download
1 / 28
300 likes | 563 Views
Sequence analysis course. Lecture 5 Multiple sequence alignment 1 of 3 Amino acid substitution matrices. What it better to align: DNA or protein sequences ?. Rule of thumb: if ORF exists, then align at protein level.

E N D
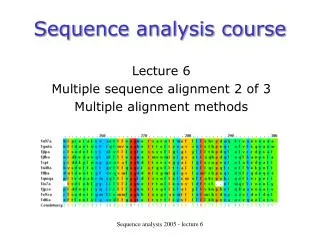
Sequence analysis course Lecture 5 Multiple sequence alignment 1 of 3 Amino acid substitution matrices Sequence analysis 2005 - lecture 5
What it better to align: DNA or protein sequences ? Rule of thumb: if ORF exists, then align at protein level • Many mutations within DNA are synonymous. This leads to divergence over-estimation. Sequence analysis 2005 - lecture 5
Evolutionary relationships can be more accurately expressed using a 20×20 amino acid exchange table. • DNA sequences contain non-coding regions, which should be avoided in homology searches. • Still an issue when translating into (six) protein sequences through a codon table. • Searching at protein level: frameshifts can occur, leading to stretches of incorrect amino acids and possibly elongation of sequences due to missed stop codons. However, frameshifts normally result in stretches of highly unlikely amino acids. Sequence analysis 2005 - lecture 5
Substitution matrix motivation • Lets consider a simple alignment: ungapped global alignment of two (protein) sequences, x and y, of length n. • In scoring this alignment, we would like to assess whether these two sequences have a common ancestor, or whether they are aligned by chance. • We therefore want our amino acid substitution table (matrix) to score an alignment by estimating this ratio (= improvement over random). • In brief, each substitution score is the log-odds probability that amino acid a could change (mutate) into amino acid b through evolution, based on the constraints of our evolutionary model. • How do we get these substitution scores? Sequence analysis 2005 - lecture 5
Target and background probabilities • BACKGROUND PROBABILITYIf qa is the frequency of amino acid a in one sequenceand qb is the frequency of amino acid b in another sequence, then the probability of the alignment being random is given by: • TARGET PROBABILITYIf pab is now the probability that amino acids a and b have derived from a common ancestor, then the probability that the alignment is due to common ancestry is is given by: Sequence analysis 2005 - lecture 5
Source of target and background probabilities • TARGET FREQUENCIESThe key idea is to refer to high confidence alignments.The “evolutionary true” alignments allow us to get biologically permissible amino acid mutations and derive the frequencies of observed pairs.These are the TARGET frequencies (20x20 combinations). • BACKGROUND FREQUENCIESThe BACKGROUND frequencies are simply the frequency at which each amino acid type is observed in these “trusted” data sets (20 values). Sequence analysis 2005 - lecture 5
Log-odds • The odds ratio of these two probabilities is given by: • The log-odds probability of an alignment being random is therefore give by: • NB. Sequence analysis 2005 - lecture 5
Alignment score • The alignment score S is given by the sum of all amino acid pair substitution scores: • where the substitution score for any amino acid pair [a,b] is given by: Sequence analysis 2005 - lecture 5
Alignment score • The total score of an alignment:would be: Sequence analysis 2005 - lecture 5
The PAM series • The first systematic method to derive amino acid substitution matrices was done by Margaret Dayhoff et al. (1978) Atlas of Protein Structure. These widely used substitution matrices are frequently called Dayhoff, MDM (Mutation Data Matrix), or PAM (Percent Accepted Mutation) matrices. • PAM approach: estimate the probability that b was substituted for a in a given measure of evolutionary distance. • KEY IDEA: trusted alignments of closely related sequences provide information about biologically permissible mutations. Sequence analysis 2005 - lecture 5
The PAM design • Step 1. Dayhoff used 71 protein families, made hypothetical phylogenetic trees and recorded the number of observed substitutions in a 20x20 target matrix. Sequence analysis 2005 - lecture 5
The PAM design • Step 2. The target matrix was then converted to frequencies by dividing each cell (a,b) over the sum of all other substitutions of a. • Step 3. The target matrix was normalized so that the expected number of substitutions covered 1% of the protein (PAM-1). • Step 4. Determine the final substitution matrix. Sequence analysis 2005 - lecture 5
X X = PAM matrices • There is a whole series of matrices: PAM-10, …, PAM-250, … • These matrices are extrapolated from PAM-1 matrix (by matrix multiplication). • A PAM is a relative measure of evolutionary distance: • 1 PAM = 1 accepted mutation per 100 amino acids • 250 PAM = 2.5 accepted mutations per amino acid Multiply Matrices N times to make PAM “X”; then take the Log Sequence analysis 2005 - lecture 5
The PAM250 matrix A 2 R -2 6 N 0 0 2 D 0 -1 2 4 C -2 -4 -4 -5 12 Q 0 1 1 2 -5 4 E 0 -1 1 3 -5 2 4 G 1 -3 0 1 -3 -1 0 5 H -1 2 2 1 -3 3 1 -2 6 I -1 -2 -2 -2 -2 -2 -2 -3 -2 5 L -2 -3 -3 -4 -6 -2 -3 -4 -2 2 6 K -1 3 1 0 -5 1 0 -2 0 -2 -3 5 M -1 0 -2 -3 -5 -1 -2 -3 -2 2 4 0 6 F -4 -4 -4 -6 -4 -5 -5 -5 -2 1 2 -5 0 9 P 1 0 -1 -1 -3 0 -1 -1 0 -2 -3 -1 -2 -5 6 S 1 0 1 0 0 -1 0 1 -1 -1 -3 0 -2 -3 1 2 T 1 -1 0 0 -2 -1 0 0 -1 0 -2 0 -1 -3 0 1 3 W -6 2 -4 -7 -8 -5 -7 -7 -3 -5 -2 -3 -4 0 -6 -2 -5 17 Y -3 -4 -2 -4 0 -4 -4 -5 0 -1 -1 -4 -2 7 -5 -3 -3 0 10 V 0 -2 -2 -2 -2 -2 -2 -1 -2 4 2 -2 2 -1 -1 -1 0 -6 -2 4 B 0 -1 2 3 -4 1 2 0 1 -2 -3 1 -2 -5 -1 0 0 -5 -3 -2 2 Z 0 0 1 3 -5 3 3 -1 2 -2 -3 0 -2 -5 0 0 -1 -6 -4 -2 2 3 A R N D C Q E G H I L K M F P S T W Y V B Z W-R exchange is too large (due to paucity of data) Sequence analysis 2005 - lecture 5
PAM model • The scores derived through the PAM model are an accurate description of the information content (or the relative entropy) of an alignment (Altschul, 1991). • PAM-1 corresponds to about 1 million years of evolution. • PAM-120 has the largest information content of the PAM matrix series: “best” for general alignment. • PAM-250 is the traditionally most popular matrix: “best” for detecting distant sequence similarity. Sequence analysis 2005 - lecture 5
Summary Dayhoff’s PAM-matrices • Derived from global alignments of closely related sequences. • Matrices for greater evolutionary distances are extrapolated from those for lesser ones. • The number with the matrix (PAM40, PAM100) refers to the evolutionary distance; greater numbers are greater distances. • Several later groups have attempted to extend Dayhoff's methodology or re-apply her analysis using later databases with more examples. • Extensions of Dayhoff’s methodology: > Jones, Thornton and coworkers used the same methodology as Dayhoff but with modern databases (CABIOS 8:275).> Gonnett and coworkers (Science 256:1443) used a slightly different (but theoretically equivalent) methodology. > Henikoff & Henikoff (Proteins 17:49) compared these two newer versions of the PAM matrices with Dayhoff's originals. Sequence analysis 2005 - lecture 5
The BLOSUM matrices(BLOcks SUbstitution Matrix) • The BLOSUM series of matrices were created by Steve Henikoff and colleagues (PNAS 89:10915). • Derived from local, un-gapped alignments of distantly related sequences. • All matrices are directly calculated; no extrapolations are used. • Again: the observed frequency of each pair is compared to the expected frequency (which is essentially the product of the frequencies of each residue in the dataset). Then: Log-odds matrix. Sequence analysis 2005 - lecture 5
The Blocks Database • The Blocks Database contains multiple alignments of conserved regions in protein families. • Blocks are multiply aligned un-gapped segments corresponding to the most highly conserved regions of proteins. • The blocks for the BLOCKS database are made automatically by looking for the most highly conserved regions in groups of proteins represented in the PROSITE database. These blocks are then calibrated against the SWISS-PROT database to obtain a measure of the random distribution of matches. It is these calibrated blocks that make up the BLOCKS database. • The database can be searched by e-mail and World Wide Web (WWW) servers (http://blocks.fhcrc.org/help) to classify protein and nucleotide sequences. Sequence analysis 2005 - lecture 5
The Blocks Database Gapless alignment blocks Sequence analysis 2005 - lecture 5
The BLOSUM series • BLOSUM30, 35, 40, 45, 50, 55, 60, 62, 65, 70, 75, 80, 85, 90. • The number after the matrix (BLOSUM62) refers to the minimum percent identity of the blocks (in the BLOCKS database) used to construct the matrix (all blocks have >=62% sequence identity); • No extrapolations are made in going to higher evolutionary distances • High number - closely related sequences Low number - distant sequences • BLOSUM62 is the most popular: best for general alignment. Sequence analysis 2005 - lecture 5
The log-odds matrix for BLOSUM62 Sequence analysis 2005 - lecture 5
Based on an explicit evolutionary model Derived from small, closely related proteins with ~15% divergence Higher PAM numbers to detect more remote sequence similarities Errors in PAM 1 are scaled 250X in PAM 250 Based on empirical frequencies Uses much larger, more diverse set of protein sequences (30-90% ID) Lower BLOSUM numbers to detect more remote sequence similarities Errors in BLOSUM arise from errors in alignment PAM versus BLOSUM Sequence analysis 2005 - lecture 5
Comparing exchange matrices • To compare amino acid exchange matrices, the "Entropy" value can be used. This is a relative entropy value (H) which describes the amount of information available per aligned residue pair. Sequence analysis 2005 - lecture 5
Specialized matrices • Claverie (J.Mol.Biol 234:1140) developed a set of substitution matrices designed explicitly for finding possible frameshifts in protein sequences.These matrices are designed solely for use in protein-protein comparisons; they should not be used with programs which blindly translate DNA (e.g. BLASTX, TBLASTN). Sequence analysis 2005 - lecture 5
Specialized matrices • Rather than starting from alignments generated by sequence comparison, Rissler et al (1988) and later Overington et al (1992) only considered proteins for which an experimentally determined three dimensional structure was available. • They then aligned similar proteins on the basis of their structure rather than sequence and used the resulting sequence alignments as their database from which to gather substitution statistics. In principle, the Rissler or Overington matrices should give more reliable results than either PAM or BLOSUM. However, the comparatively small number of available protein structures (particularly in the Rissler et al study) limited the reliability of their statistics. • Overington et al (1992) developed further matrices that consider the local environment of the amino acids. Sequence analysis 2005 - lecture 5
A note on reliability • All these matrices are designed using standard evolutionary models. • It is important to understand that evolution is not the same for all proteins, not even for the same regions of proteins. • No single matrix performs best on all sequences. Some are better for sequences with few gaps, and others are better for sequences with fewer identical amino acids. • Therefore, when aligning sequences, applying a general model to all cases is not ideal. Rather, re-adjustment can be used to make the general model better fit the given data. • But we will go in to this in the next lectures. Sequence analysis 2005 - lecture 5
Pair-wise alignment quality versus sequence identity(Vogt et al., JMB 249, 816-831,1995) Sequence analysis 2005 - lecture 5
Take home messages • If ORF exists, then align at protein level. • Amino acid substitution matrices reflect the log-odds ratio between the evolutionary and random model and can therefore help in determining homology via the alignment score. • The evolutionary and random models depend on the generalized data used to derive them. This not an ideal solution. • Apart from the PAM and BLOSUM series, a great number of further matrices have been developed. • Matrices have been made based on DNA, protein structure, information content, etc. • For local alignment, BLOSUM62 is often superior; for distant (global) alignments, BLOSUM50, GONNET, or (still) PAM250 work well. • Remember that gap penalties are always a problem; unlike the matrices themselves, there is no formal way to calculate their values -- you can follow recommended settings, but these are based on trial and error and not on a formal framework. Sequence analysis 2005 - lecture 5