Download
1 / 16
160 likes | 278 Views
The Effect of Fluorescent Labelling on Deformability and Geometric Properties of Red Blood Cells. Joanne Wong Supervisor: Dr. D. Jackson March 23,2011 Medical Biophysics Department University of Western Ontario. Acknowledgement. Supervisor: Dr. Dwayne N. Jackson

E N D
The Effect of Fluorescent Labelling on Deformability and Geometric Properties of Red Blood Cells Joanne Wong Supervisor: Dr. D. Jackson March 23,2011 Medical Biophysics Department University of Western Ontario
Acknowledgement • Supervisor: Dr. Dwayne N. Jackson • Graduate Student Mentor: Baraa Al-Khazraji • Source of funding: NSERC
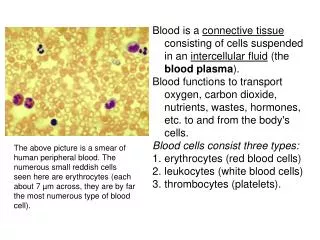
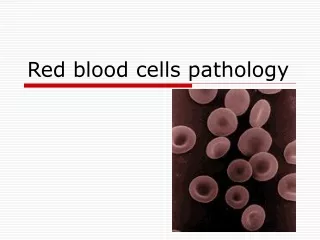
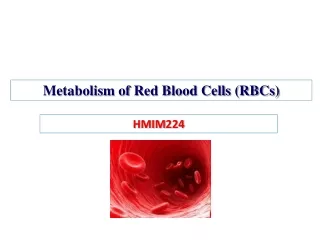
Introduction • Blood cells • Hemodynamic • Directly measure • Microspheres and fluorescent cells • Trace cells in microvasculature • Do stained cells behave the same as unstained cells?
Hypothesis There will be no differences in deformability or geometry between stained and unstained red blood cells
Methods Split portions Extract blood Dye and incubate 5 hours (FITC) Wash cells 1 hour Hang test 2 minutes Image slides
Methods • Hang test • ImageJ
Theoretical Model • Criteria for measurements (2) Diameter Thickness Circle diameter
Results n=20 n=20 n = 99 n = 99 Mean value : Unstained= 7.624 ± 0.475 µm Stained= 7.440 ± 0.367 µm A T-test was performed with p value = 0.179
n=20 n=20 n = 99 n = 99 Mean value : Unstained= 130.890 ± 15.711 µm2 Stained = 125.490 ± 12.739 µm2 A T-test was performed for a p value = 0.24
n=20 n=20 n = 99 n = 99 Mean value : Unstained= 48.544 ± 10.025 µm3 Stained = 46.158 ± 4.615 µm3 A T-test was performed with a p value = 0.340
n=20 n=20 n = 99 Mean value : Unstained= 0.490± 0.022 Stained = 0.498 ± 0.037 A T-test was performed with a p value = 0.357
Complementary Study Methods Unstained Stained Albumin 0.5% per 500mL Albumin 0.5% per 500mL Albumin free
Summary & Discussion • Simple math model vs. hand tracing • Results showed no significant difference • Effects of albumin buffer • FIT-C dye does not affect deformability and geometrical difference • Possible modification of staining protocol?
Thank You! Contact me at: twong227@uwo.ca