Download
1 / 34
340 likes | 551 Views
W. Ebisuzaki, F. Mesinger, G. DiMego, E. Kalnay, K. Mitchell, M. Ek, R. Grumbine, D. Jovic, P. Shafran, and J. Woolen http://wwwt.emc.ncep.noaa.gov/mmb/rreanl/index.html. An Overview of the North American Regional Reanalysis.

E N D
W. Ebisuzaki, F. Mesinger, G. DiMego, E. Kalnay, K. Mitchell, M. Ek, R. Grumbine, D. Jovic, P. Shafran, and J. Woolen http://wwwt.emc.ncep.noaa.gov/mmb/rreanl/index.html An Overview of the North American Regional Reanalysis
Motivation for North American Regional Reanalysis (NARR) • Create hi-resolution reanalysis for the North American domain • Address some of the weakness of the N/N Reanalysis, i.e., near surface temperature, winds • Hydrology in the North American domain • Make a more useful reanalysis (for people who want point values and live on the surface Expectations • more applied meteorological applications • more uncertain about how non-meteorologists will use the data
High Lights of NARR • ETA model and assimilation system (EDAS) • 32 km resolution over the North and Central America • R-2 horizontal boundary conditions • new land surface model (NOAH) • precipitation assimilation • 8x daily analyses from October 1978 onwards • 5 TB for basic set of analyses and fluxes • Oct 1978-Nov 2002 done
ETA / NOAH LAND-SURFACE MODEL UPGRADES: 24 Jul 01 - assimilation of hourly precipitation -- hourly 4-km radar/gage analysis (Stage IV) - cold season processes(Koren et al 1999) -- patchy snow cover -- frozen soil (new state variable) -- snow density (new state variable) - bare soil evaporation refinements -- parameterize upper sfc crust cap on evap - soil heat flux -- new soil thermal conductivity (Peters-Lidard et al 1998) -- under snowpack (Lunardini, 1981) -- vegetation reduction of thermal cond. (Peters-Lidard et al 1997) - surface characterization-- maximum snow albedo database (Robinson & Kukla 1985) -- dynamic thermal roughness length refinements - vegetation -- deeper rooting depth in forests -- canopy resistance refinements NOAH LSM tested in various land-model intercomparison projects, e.g., GSWP, PILPS 2a, 2c, 2d, 2e, Rhone, and (near-future) DMIP.
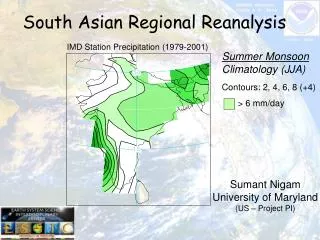
Precipitation • Several sources of precipitation • CONUS data with PRISM (Mountain Mapper) to improve orographic effects • Canada • Mexico • CMAP (combination of satellite and gauge data) over oceans; CMAP is blocked: • Near central areas of hurricanes (7.5 by 7.5 deg) • Observed precipitation > 100 mm/day • A 15-degree 'blending belt' between 27.5 and 42.5 N, with no CMAP north of 42.5 N
N. Am. Sector Grid point 32 km resolution 45 pressure levels NOAH model (2002) Realistic soil types 4 soil layers Snow depth, modeled/observed 3 hour analyses time steps Comparison of N/N Reanalysis and NARRmodel • Global • Spectral • ~250 km resolution • 28 sigma levels • Land sfc (Pan and Marht, 1987) • One soil type (sandy loam) • Two soil levels • Simplistic snow depth, fn(T) • 6 hour analyses time steps
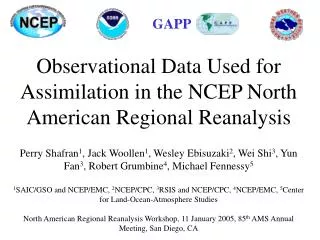
Sondes, aircraft, profilers Direct assimilation of radiances Satellite winds Land sfc: prs, q, winds Ocean sfc: prs, q, t, winds Precipitation USAF snow depth (hi res) Reynold's SST + lakes Sea ice from R. Grumbine + lakes Comparison of N/N Reanalysis and NARRinput observations • Sondes, aircraft • TOVS temperature retrievals • Satellite winds • Land sfc: prs • Ocean sfc: prs, q, t, winds • Snow cover: old is low res • Reynold's SST • Sea ice from R. Grumbine
Software: ~2002 Analyses: Oct 1978-Nov 2002 Nov 2002+ in development Comparison of N/N Reanalysis and NARRdates • Software: ~1994 • Analyses: 1948-present
32 km 45 levels Frozen physics Better precip obs Better lake obs Operational ETA vs NARR • 12 km • 60 levels • Evolving physics • Precip assim for CONSUS • Lakes: SST, ice-real time
Operational ETA vs NARRUser Output: RR is more friendly • RR: 1 grib table vs 3 grib tables for OPN (some software cannot handle multiple tables) • RR: Winds are N/S vs grid-relative winds in OPN (some software cannot handle grid-relative winds) • RR: new variables: moisture fluxes, etc • RR: redundant variables removed: ex dew pt, rel q, specific q • RR: added new BL levels, removed others • RR: BUFR files have QC and increments • RR: many monitoring plots
Why NARR should have better surface values 1) higher horizontal orography: 32 km vs ~250 km need to resolve orography 2) better land surface model to get 2m temp and q .. need better sfc fluxes 3) assimilated precipitation better model precipitation .. clouds, radiative flux better soil moisture .. latent and sensible heat flux 4) gridded snow depth is similar to NARR resolution a problem with NCEP's global reanalyses 5) assimilate more near surface data (winds, q) 6) 3 hour assim cycle, better resolve diurnal cycle
Principal Output Datasets • Observations with QC marks, increments (BUFR) • plots: obs locations, fit to sondes, fit to sfc obs, • fit to global reanalysis, various NARR fields • binary restart files (to rerun model, high resolution), very big, small usage • GRIB analyses and first guess on model grid big, no interpolation errors • GRIB analyses and first guess on Lambert conformal 32-km grid, big, easier to use, interpolation error • Merged: GRIB analyses and averaged/accumulated flux/precip and some 1st guess fields for water budgets, Lambert Conformal grid (AWIP 221), 5 TB for 8x daily for entire period. This will be work-horse data set.
Data Distribution • NCAR • SDSC (San Diego Super Computing Center, UCSD) • U. of Maryland • NCDC-NOMADS (NOAA Operational Model Archive Distribution System)
NOMADS • Partnership of many organizations including core collaborators: CDC, COLA, FSL, GFDL, LLNL, NCAR, NCDC, NCEP, PMEL, UNIDATA • On-line access to the merged RR data set (analyses + fluxes+some first guess) • NCDC: 7 TB on-line storage, web servers, x-TB tape storage • NCEP: ¾ TB on-line, web servers, software upgrades • Software: • on-line plotting package • on-line slice-and-dice of GRIB files • GrADS-DODS • Status: • plotting package will be enhanced by NCEP • downloading of GRIB files will be enhanced by NCEP • GrADS-DODS needs enhancements • NOMADS-NCDC has experience running software
Download what you want: Select: 1) variables 2) levels 3) times 4) domain 5) resolution: 32 km, 64 km, 96 km Downloading can be scripted I can't download the 5 TB merged data set!
Oct 4, 2003 Finished Oct 1978 to mid-Nov 2002 no more inland lake data no 2003 Canadian precip currently planning the real-time NARR will use different datasets as some precip/lake data are not available in real time currently planning subsets and archive Dec 2003 internet-2 will be available at NCDC and distribution to archive sites can start Until NARR appears at archive sites, you can look at 1 year of merged data at NCEP. http://wwwt.emc.ncep.noaa.gov/mmb/rreanl/index.html Summary