Download
1 / 34
340 likes | 357 Views
Uncertainty. How “certain” of the data are we? How much “error” does it contain? How well does the model match reality?. Goal: Understand and document uncertainties from data collection to publication. LifeMapper: Tamarix chinensis. LifeMapper.org. LifeMapper: Loggerhead Turtles.

E N D
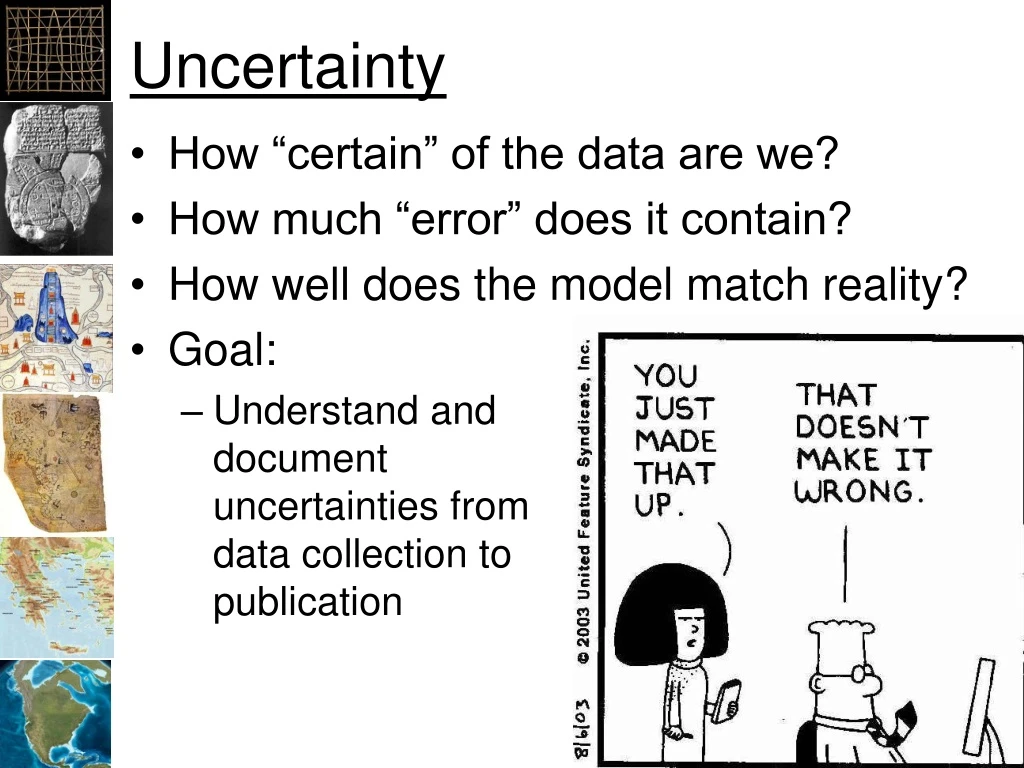
Uncertainty • How “certain” of the data are we? • How much “error” does it contain? • How well does the model match reality? • Goal: • Understand and document uncertainties from data collection to publication
LifeMapper: Tamarix chinensis LifeMapper.org
LifeMapper: Loggerhead Turtles LifeMapper.org
Road Map of Uncertainty Sample Data • Spatial Precision • Spatial Accuracy • Sample Bias • Identification Errors • Date problems • Gross Errors • Gridding Predictor Layers • Noise • Correlation • Interpolation Error • Spatial Errors • Measurement Errors • Temporal Uncertainty Modeling Software • Over fitting? • Assumptions? Settings • How to determine? Model Performance Measures Number of Parameters AIC, AICc, BIC, AUC Response Curves Habitat Map • Realistic? • Uncertainty maps? • Match expectations? • Over-fit? • Accurate measures? What is the best model?
Occurrences of Polar Bears From The Global Biodiversity Information Facility (www.gbif.org, 2011)
January 1st Dates • If you put just a “year”, like 2011, into a relational database, the database will return: • Midnight, January 1st, of that year • In other words: • 2011 becomes: • 2011-01-01 00:00:00.00
Predictor Layers • Remotely sensed: • DEMs, Visual, IR, NIR, SST, NPP, Sea Height • Integrated from multiple data sets: • Bathymetry • Interpolated: • Temp, precipitation, wind • DO, Sub-surface temp, salinity, bottom type • Processed from other layers: • Slope, aspect, distance to shore • From other models: • Climate
Red Snapper • An important recreational and commercial species • $7 - 70 million/year www.safmc.net lickyourownbowl.wordpress.com outdooralabama.com
SEAMAP Trawls (>47,000 records) Red Snapper Occurrences (>6,000 records)
Sample Data • Spatial Precision • Standard Deviation of about 2 km • Spatial Accuracy: • < 1km • Sampling Bias: • Some areas more heavily sampled • Identification Errors: • Unknown but red snapper are pretty easy to identify • Date problems: • Not a temporal model • Gridding: • Not at 9 kilometers
Jiggling The Samples • Randomly shifting the position of the points based on a given standard deviation based on sample uncertainty • Running the model repeatedly to see the potential effect of the uncertainty
Sea Surface Temperature (SST) NOAA AVHRR Pathfinder Satellite Spatial: 9km Measured: <0.4 K Net Primary Production (NPP) Milligrams of Carbon per Meter Squared per Day OSU Ocean Productivity Uncertainty? Density of Platforms and Pipelines Created from Bureau of Ocean Energy Management (BOEM) Point Data Set Uncertainty? Bathymetry Resampled from 90m NOAA Coastal Inundation Dataset And others Uncertainty < 9km
Predictor Resolution • Should model at the lowest resolution of the predictor layers or lower • Lower resolution: • Can reduce problems from sample data uncertainty • In same cases can combine sample data into measures such as CPUE, density, abundance • Reduces detail of final model • For these tests: 9km
Predictor Layer Uncertainty • Noise: Minimal • Correlation: Eliminate NPP • Spatial Errors: Unknown, < 9km? • Measurement errors: Minimal to Unknown Spearman’s Coefficient NPP to SST Correlation: 0.99
Modeling Software: Maxent • Popular, relatively easy to use • Only requires presence points • Known for over-fitting • Performs “piece-wise” regression • Assumes: • Predictors are error free • Independence of errors in response • Lack of correlation in predictors • Constant variance • Random data collection over sample area
Experiments • Different regularization multipliers • Select regularization for other tests • Try different numbers of samples • Determine the number of samples to use • “Jiggle” the sample data spatially • Introduce different amounts of spatial error
Regularization=0.1 Regularization=1.2 Regularization=10
10% Sample Points Optimal Habitat Poor Habitat 100% Sample Points
Jiggling No Jiggling StdDev=4.4km StdDev=55km
Jiggling • Spearman’s Correlation 0 vs. 4.4km, Correlation = .997 0 vs. 55km, Correlation = .919
Uncertainty Maps • Standard Deviation of Jiggling Points by 4.4km 0.0008 0.32
Conclusions • We can improve HSMs over the default settings in Maxent • We can determine uncertainty in some cases • Next Steps • Support uncertainty for each data point • Improve uncertainty analysis and visualization for predictor layers • Begin adding uncertainty analysis and maps to products
Communicating Uncertainy Colleen Sullivan, 2012
References • Anderson, Model Based Inference in the Life Sciences: A Primer on Evidence • AVHRR Technical Specifications: http://data.nodc.noaa.gov/pathfinder/Version5.2/GDS_TechSpecs_v2.0.pdf • Chil’s JP, Delfiner P , Geostatistics: Modeling Spatial Uncertainty • Franklin J, Mapping Species Distributions: Spatial Inference and Prediction. Cambridge University Press, Cambridge • Hunsaker CT et. al., Spatial Uncertainty in Ecology: Implications for Remote Sensing and GIS Applications • Maxent: http://www.cs.princeton.edu/~schapire/maxent/ • Phillips SJ, Anderson RP, Schapire RE (2006) Maximum entropy modeling of species geographic distributions. Ecol Model 190 (3-4):231-259. • Warren DL, Seifert SN (2011) Ecological niche modeling in Maxent: the importance of model complexity and the performance of model selection criteria. Ecological Applications 21 (2):335-342. • Wenzhong S, Principles of Modeling Uncertainties in Spatial Data and Spatial Analyses
Other Issues… • Selecting background (absence points) • Clamping: • Prevents prediction outside the predictors used to create the model • Thresholds
Communicating Uncertainy Colleen Sullivan, 2012
Staircase of Knowledge Wisdom Judgment Understanding Comprehension Integration Knowledge Organization Interpretation Information Human value added Selection Testing Data Observation And Measurement Verification Increasing Subjectivity Environmental Monitoring and Characterization, Aritola, Pepper, and Brusseau