Download
1 / 42
420 likes | 424 Views
This article explores the impact of increasing wind and solar energy penetration on transient frequency performance in power systems, highlighting the challenges and potential risks. It discusses the importance of inertia and control mechanisms in maintaining frequency stability, particularly in the context of decreased fossil-based generation. The study also addresses the effects of environmental regulations and renewable energy integration on frequency control and system reliability.

E N D
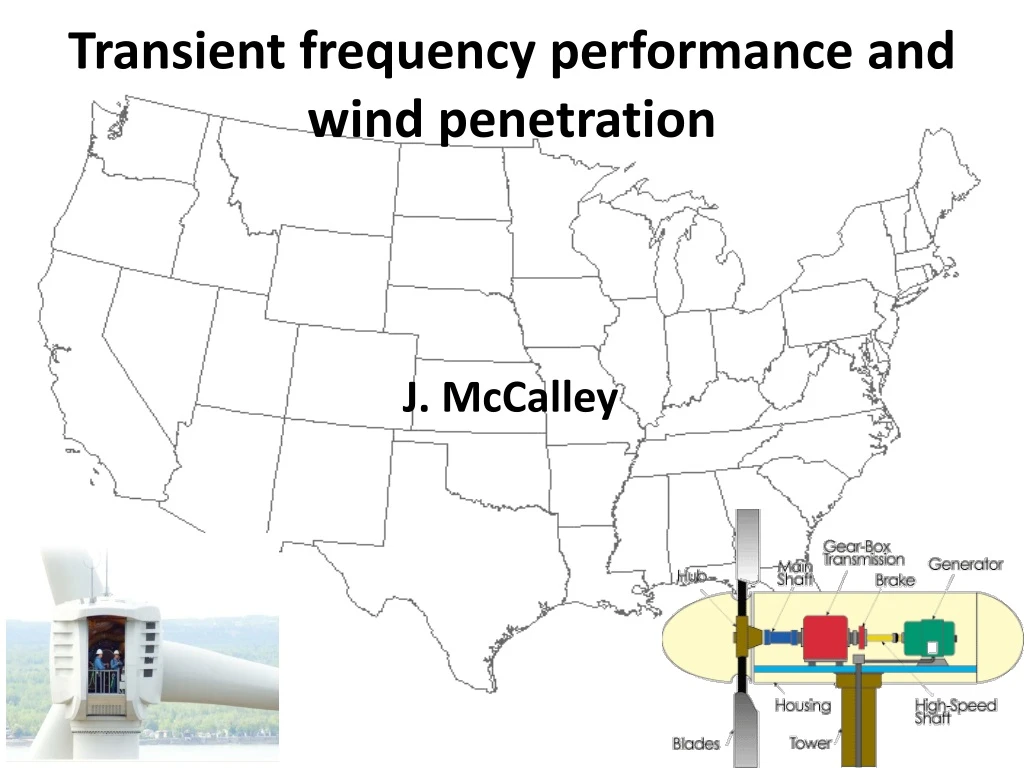
J. McCalley Transient frequency performance and wind penetration
Content • Motivation • Power balance-frequency basics • Frequency Performance Analysis
Motivation • In many parts of the country, wind and/or solar is increasing. • Fossil-based generation is being retired because • There is significant resistance to coal-based plants due to their high CO2 emission rates. • There are other environmental concerns, e.g., once-through cooling (OTC) units in California and the effects of EPA’s Cross-state air pollutions rules (CSAPR) and Mercury and Air Toxic Standards (MATS) (also known as Maximum Achievable Control Technology, MACT). For CSAPR effects, see, e.g., www.powermag.com/POWERnews/4011.html (Texas shut downs) and for CSAPR/MATS effects, see the next slide. For OTC effects, see www.world-nuclear-news.org/RS-California_moves_to_ban_once_through_cooling-0605105.html, http://www.caiso.com/1c58/1c58e7a3257a0.html, and next-next slide. • Fossil-based generation contributes inertia. Wind and solar do not contribute inertia, unless they are using inertial emulation. • Inertia helps to limit frequency excursions when power imbalance occurs. Decreased fossil w/ increased wind/solar creates trans freq risk.
Potential effects of CSAPR/MATS Source: A. Saha, “CSAPR & MATS: What do they mean for electric power plants?” presentation slides at the 15th Annual Energy, Utility, and Environmental Conference, Jan 31, 2012, available at www.mjbradley.com/sites/default/files/EUEC2012_Saha_MATS-CSAPR.pdf.
Once-through cooling units in S. California New wind and solar generation due to Cal requiring 33% by 2020. There are 8 plants (26 units) that are impacted Total potential MW capacity at risk = 7,416 MW. Load center
Frequency Study Basics • Inertia The greater the inertia, the less acceleration will be observed and the less will be the frequency deviation. Inertia is proportional to the total rotating mass. • Primary Control Senses shaft speed, proportional to frequency, and modifies the mechanical power applied to the turbine to respond to the sensed frequency deviations.
First 2 Levels of Frequency Control • The frequency declines from t=0 to about t=2 seconds. This frequency decline is due to the fact that the loss of generation has caused a generation deficit, and so generators decelerate, utilizing some of their inertial energy to compensate for the generation deficit. • The frequency recovers during the time period from about t=2 seconds to about t=9 seconds. This recovery is primarily due to the effect of governor control (also, underfrequency load shedding also plays a role). • At the end of the simulation period, the frequency has reached a steady-state, but it is not back to 60 Hz. This steady-state frequency deviation is intentional on the part of the governor control and ensures that different governors do not constantly make adjustments against each other. The resulting steady-state error will be zeroed by the actions of the automatic generation control (AGC).
First 2 Levels of Frequency Control – another look This is load decrease, shown here as a gen increase. Source: FERC Office of Electric Reliability available at: www.ferc.gov/EventCalendar/Files/20100923101022-Complete%20list%20of%20all%20slides.pdf
First 3 Levels of Frequency Control The Sequential Actions of frequency control following the sudden loss of generation and their impact on system frequency
First 3 Levels of Frequency Control The Sequential Actions of frequency control following the sudden loss of generation and their impact on system frequency
Renewable Integration Effects on Frequency Our work in these slides is about the first two bullets. • Reduced inertia, assuming renewables do not have inertial emulation • Decreased primary control (governors), assuming renewables do not have primary controllers • Decreased secondary control (AGC), assuming renewables are not dispatchable. • Increased net load variability, a regulation issue • Increased net load uncertainty, a unit commitment issue
A power system experiences a load increase (or equivalently, a generation decrease) of ∆PL at t=0, located at bus k. At t=0+, each generator i compensates according to its proximity to the change, as captured by the synchronizing power coefficient PSik between units i and k, according to Transient frequency control (1) Equation (1) is derived for a multi-machine power system model where each synchronous generator is modeled with classical machine models, loads are modeled as constant impedance, the network is reduced to generator internal nodes, and mechanical power into the machine is assumed constant. Then the linearized swing equation for gen i is …
(2) KE in MW-sec of turb-gen set, when rotating at ωR Transient frequency control For a load change PLk, at t=0+, substituting (1) into the right-hand-side of (2): (3) Bring Hi over to the right-hand-side and rearrange to get: (4) For PL>0, initially, each machine will decelerate but at different rates, according to PSik/Hi.
Now rewrite eq. (3) with Hi inside the differentiation, use i instead of i, write it for all generators 1,…,n, then add them up. All Hi must be given on a common base. Transient frequency control (5a) (5b) We will come back to this equation (5b).
Now define the “inertial center” of the system, in terms of angle and speed, as • The weighted average of the angles: Transient frequency control or (6) • The weighted average of the speeds: (7) or Differentiating with respect to time, we get…
(8) Transient frequency control Solve for the numerator on the right-hand-side, to get: (9) Now substitute (9) into (5b) to get: (10) (5b)
(10) Bring the 2*(summation)/ωRe over to the right-hand-side: Transient frequency control (11a) Eq. (11a) gives the average deceleration of the system, m, the initial slope of the avg frequency deviation plot vs. time. This has also been called the rate of change of frequency (ROCOF) [*]. All Hi (units of seconds) must be given on a common power base for (11a) to be correct. In addition -∆PL should be in per-unit, also on that same common base, so that -∆PL/2 ΣHi is in pu/sec, and mω=-∆PL ωRe/2 ΣHi is in rad/sec/sec. Alternatively, Units of Hz/sec (11b) [*] G. lalor, A. Mullane, and M. O’Malley, “Frequency control and wind turbine technologies,” IEEE Trans. On Power Systems, Vol. 20, No. 4, Nov. 2005.
Consider losing a unit of ∆PGat t=0. Assume: • There is no governor action between time t=0+and time t=t1 (typically, t1 might be about 1-2 seconds). • The deceleration of the system is constant from t=0+ to t=t1. • The frequency will decline to 60-mft1. The next slide illustrates. Transient frequency control
Frequency(Hz) t1 Time (sec) 60 mf1 60-mf1t1 mf2 60-mf2t1 mf3 60-mf3t1 Transient frequency control • The greater the ROCOF following loss of a generator ∆PG, the lower will be the frequency dip. • ROCOF increases as total system inertia ΣHi decreases. • Therefore, frequency dip increases as ΣHi decreases.
Frequency Basics • Aggregation • Network frequency is close to uniform throughout the inter-connection during the 0-20 second time period of interest for transient frequency performanceavg freq is representative. • For analysis of average frequency, the inertial and primary governing dynamics may be aggregated into a single machine. • This means the interconnection’s (and not the balancing area’s) inertia is the inertia of consequence when gen trips happen.
Inertia and primary control from solar PV and wind • A squirrel-cage machine or a wound-rotor machine (types 1 and 2) do contribute inertia. • DFIG and PMSG wind turbines (types 3 and 4) and Solar PV units cannot see or react to system frequency change directly unless there is an “inertial emulation” function deployed, because power electronic converters isolate wind turbine/solar PV from grid frequency. No inertial response from normal control methods of wind & solar • Neither wind nor solar PV use primary control capabilities today. • There is potential for establishing both inertial emulation and primary control for wind and solar in the future, but so far, in North America, only Hydro Quebec is requiring it.
So what is the issue with wind types 3,4 & solar PV….? Increasing wind & solar PV penetrations tend to displace (decommit) conventional generation. DFIGs & solar PV, without special control, do not contribute inertia. This “lightens” the system (decreases denominator) DFIGs & solar PV, without special control, do not have primary control capability. Transient frequency control This causes frequency response degradation; but there are other effects that also cause frequency response degradation such as increased deadband, sliding pressure controls (changes pressure as function of load so to limit fast-response load reserve [*]), blocked governors (typical on nuclear units), use of power load controllers (override governor action after short time delay to force units back to original schedule), and changes in frequency response characteristics of the load. [*] B. Vitalis, “Constant and sliding-pressure options for new supercritical plants,” Power, Jan/Feb 2006, available at http://www.babcockpower.com/pdf/rpi-14.pdf.
Frequency Governing Characteristic, β β, • The above is eastern interconnection characteristic. Decline is not caused by wind/solar. However, IF… • wind/solar displaces conventional units having inertia and having primary control • wind/solar does not have appropriate control. • THEN wind/solar will exacerbate decline in β. “If Beta were to continue to decline, sudden frequency declines due to loss of large units will bottom out at lower frequencies, and recoveries will take longer.” Source: J. Ingleson and E. Allen, “Tracking the Eastern Interconnection Frequency Governing Characteristic,” Proc. of the IEEE PES General Meeting, July 2010.
Effect of frequency excursions on turbine blade life • White: Safe for continuous operation • Light shade: Restricted time operation • Dark shade: Prohibited operation Four different manufacturers A “completely safe” approach would seem to be to ensure frequency remains in the band 59.560.5 Hz.
f<59.0 Hz can impact turbine blade life. • Gens may trip an UF relay (59.94 Hz, 3 min; 58.4, 30 sec; 57.8, 7.5 sec; 57.3, 45 cycles; 57 Hz, instantaneous) • UFLS can trip interruptible load (59.75 Hz) and 5 blocks (59.1, 58.9, 58.7, 58.4, 58.3 Hz) • Can violate criteria: Potential Impacts of Low Frequency Dips This criteria is a “protection” against UFLS. UFLS is a “protection” against generator tripping. Generator tripping is a “protection” against loss of turbine life. 27
Some illustrations Nadir: The lowest point.
Crete In 2000, the island of Crete had only 522 MW of conventional generation [*]. One plant has capacity of 132 MW. Let’s consider loss of this 132 MW plant when the capacity is 522 MW. Then remaining capacity is 522-132=400 MW. If we assume that all plants comprising that 400 MW have inertia constant (on their own base) of 3 seconds, then the total inertia following loss of the 132 MW plant, on a 100 MVA base, is [*] N. Hatziargyriou, G. Contaxis, M. Papadopoulos, B. Papadias, M. Matos, J. Pecas Lopes, E. Nogaret, G. Kariniotakis, J. Halliday, G. Dutton, P. Dokopoulos, A. Bakirtzis, A. Androutsos, J. Stefanakis, A. Gigantidou, “Operation and control of island systems-the Crete case,” IEEE Power Engineering Society Winter Meeting, Volume 2, 23-27 Jan. 2000, pp. 1053 -1056. Then, for ∆PL=132/100=1.32 pu, and assuming the nominal frequency is 50 Hz, ROCOF is: If we assume t1=2 seconds, then ∆f=-2.75*2=-5.5 Hz, so that the nadir would be 50-5.5=44.5Hz! For a 60 Hz system, then mf=-3.3Hz/sec, ∆f=-3.3*2=-6.6 Hz, so that the nadir would be 60-6.6=53.4 Hz.
2.75 sec Nadir 49.35 Ireland Reference [*] reports on frequency issues for Ireland. The authors performed analysis on the 2010 Irish system for which the peak load (occurs in winter) is inferred to be about 7245 MW. The largest credible outage would result in loss of 422 MW. We assume a 15% reserve margin is required, so that the total spinning capacity is 8332 MW. Consider this 422 MW outage, meaning the remaining generation would be 8332-422=7910MW. The inertia of the Irish generators is likely to be higher than that of the Crete units, so we will assume all remaining units have inertia of 6 seconds on their own base. Then the total inertia following loss of the 422 MW plant, on a 100 MVA base, is Then, for ∆PL=422/100=4.32, and assuming the nominal frequency is 50 Hz, ROCOF is: Assuming t1=2.75 seconds, then ∆f=-0.227*2.75=-0.624 Hz, so that the nadir is 50-0.624=49.38Hz. The figure [*] illustrates simulated response for this disturbance. [*] G. lalor, A. Mullane, and M. O’Malley, “Frequency control and wind turbine technologies,” IEEE Trans. On Power Systems, Vol. 20, No. 4, Nov. 2005.
Note effect of system size Crete Ireland US – ERCOT Assumed each machine Hi is 6 sec on its own base. Then multiply total non-wind capacity by 6 and divide by 100. US – WECC US – Eastern Interconnection Europe China
Reasons why calculated nadir is lower than simulated one • Governors have some influence in the simulation that is not accounted for in the calculation. • Some portion of the load is modeled with frequency sensitivity in the simulation, and this effect is not accounted for in the calculation.
Some additional issues • Solar-PV is “inertia-less.” Solar-thermal is not. • Loss of X MW during off-peak is usually more severe than loss of X MW during peak. • Spinning reserve levels affect on-line inertia and therefore results of transient freq performance (the more reserves, the more on-line inertia). • Underfrequency load shedding can activate for “worse” initial freq performance (0-2 sec) and so improve 10-20 sec frequency performance. • Severe voltage decline can reduce power consumption due to voltage sensitivity of the load and thus cause improved freq performance. • The contingency selected has much effect. Loss of 2 units has greater ΔPG but less restrictive criterion, in comparison to loss of 1 unit. An as-of-yet uncategorized contingency is loss of a unit AND a fast large wind or solar ramp-down. Should this be category C? Islanding may be the worst contingency. Why?
Controlled islanding in WECC For loss of Pacific AC Intertie (3 500 kV lines connecting Oregon to California), when transfers are close to limit (4800 MW), the below remedial action scheme will operate to separate the WECC into a northern island and a southern island. The northern island sees overfrequency and therefore trips generation. The southern island sees underfrequency , causing UFLS to activate and trip load. High wind penetration in the southern island becomes more influential because of reduced total inertia within the interconnection.
Illustration of effect #2 For loss of 2800 MW, off- peak case has lower nadir than peak case. Nadir is around 59.82 / 59.74 Hz. Off-Peak Case Peak Case C: 59.0Hz
Illustration of effect #5 for loss of 2200 MW This result is counter-intuitive because low inertia case has higher nadir than high inertia case. This was because of loss of the two units caused severe voltage decline in the area, resulting in decreased power consumption due to voltage sensitivity of the load. Low inertia case High inertia case High inertia case This effect was verified by placing an SVC in the voltage-weak area (causing voltage decline to be avoided), then we see low inertia case having lower nadir than high inertia case. Low inertia case
Illustration of effect #3, #4, for loss of PACI followed by controlled islanding (effect #6c) Lower Inertia and less reserve causes bigger ROCOF, which leads to more load shedding and higher frequency during recovery period Peak Case with Lower Inertia and Less Reserve Peak Case D-
Illustration of effect #1, #4 for loss of PACI followed by controlled islanding (effect #6c) For controlled islanding (#6c), lower inertia due to converting solar CST to solar PV causes increased ROCOF (effect #1), which leads to more load shedding and higher frequency during recovery period (effect #4). Max-Solar Case with all Solar PV Max-Solar Case with CST D-
Fast renewable ramp-downs (effect #6c) Peak Case Ramp down Ramp down +loss of 1400 MW unit Ramp down+loss of 1400 MW unit with lower Inertia, lower governor, and less reserve B-: 59.6Hz • Renewable ramp-down: In 0.1 s, turn off 3300 MW renewable( 1500 wind + 1800 Solar). This is an unlikely event . It represents the extreme case of fast increase in cloud cover simultaneous with fast decrease in wind speed.
Fast renewable ramp-downs (effect #6c) Ramp down+loss of 1400 MW unit with lower Inertia, lower governor, and less reserve Below 59.6 Hz for more than 6 cycles (0.1s) B-: 59.6Hz • The above is for the same simulation as the most severe one on the previous slide but with • the frequency at different load buses is plotted here.
High-level view of control – maximum power tracking Without inertial emulation With inertial emulation