Download
1 / 31
310 likes | 314 Views
Various ATLAS/LHC slides for LES HOUCHES A M Cooper-Sarkar OXFORD W/Z production in the measurable rapidity range is mostly at small-x – conventional treatment of QCD evolution gives information on gluon PDF and unconventional possibilities for QCD evolution can also be explored.

E N D
Various ATLAS/LHC slides for LES HOUCHES • A M Cooper-Sarkar OXFORD • W/Z production in the measurable rapidity range is mostly at small-x – conventional treatment of QCD evolution gives information on gluon PDF • and unconventional possibilities for QCD evolution can also be explored
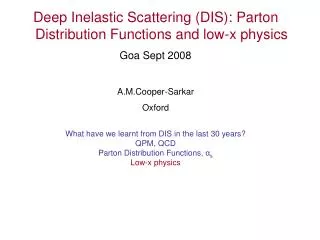
LHC is a low-x machine (at least for the early years of running Measurable rapidity range ± 2.5 Low-x information comes from evolving the HERA data Is NLO (or even NNLO) DGLAP good enough? The QCD formalism may need extending at small-x BFKL ln(1/x) resummation High density non-linear effects etc. (Devenish and Cooper-Sarkar, ‘Deep Inelastic Scattering’, OUP 2004, Section 6.6.6 and Chapter 9 for details!)
Before the HERA measurements most of the predictions for low-x behaviour of the structure functions and the gluon PDF were wrong Now it seems that the conventional NLO DGLAP formalism works TOO WELL _ there should beln(1/x) corrections and/or non-linear high density corrections for x < 5 10 -3
So it was a surprise to see F2 steep at small x - for low Q2, Q2 ~ 1 GeV2 Should perturbative QCD work? αs is becoming large - αs at Q2 ~ 1 GeV2 is ~ 0.32
`Valence-like’ gluon shape Do the data NEED unconventional explanations ? In practice the NLO DGLAP formalism works well down to Q2 ~ 1 GeV2 BUT below Q2 ~ 5 GeV2 the gluon is no longer steep at small x – in fact its becoming Valence-like We only measure F2 ~ xq dF2/dlnQ2 ~ Pqgxg Unusual behaviour of dF2/dlnQ2 may come from unusual gluon or from unusual Pqg- alternative evolution? We need other gluon sensitive measurements at low x Like FL- but a fully model independent measurement involves changing the beam energy Any possibility at HERA-II?
Q2 = 1.4 GeV2 The use of non-linear evolution equations also improves the shape of the gluon at low x, Q2 The gluon becomes steeper (high density) and the sea quarks less steep Non-linear effects gg g involve the summation of FAN diagrams – xg xuv xu xd xc xs Q2 = 2 Q2=10 Q2=100 GeV2 xg So the low-x gluon may be even steeper at high-Q2 Non linear DGLAP
W+/- production have been considered as good standard candle processes – the main uncertainty comes from PDFs. It’s a clean measurement with high statistics (300M W events/year at LHC at low Lumi.) Z rapidity б.B=2.025 ± 0.062 nb W+ rapidity б.B=12.27 ± 0.40 nb W- rapidity б.B=9.08 ± 0.30 nb NLO predictions for dб/dy. B(leptonic) for single W production at the LHC from ZEUS-S 2002 PDFs with uncertainties-( conventional evolution) PDF uncertainties of ~ ±3% in б.B, but ~±5% at central rapidity
For the W+/W- we will actually observe the leptons from the decays and the lepton ratio l-/l+ and asymmtery (l+ - l-)/(l+ + l-) W+ → l+ W- → l - Ratio Asymmetry PDF uncertainties ~±6% at central rapidity PDF uncertainties ~2% at central rapidity These rapidity distributions access low-x , x ~5.10-3 at y=0, x ~5.10-4 at y=2.5 Hence if there is a need for alternative theoretical treatment at low-x, we may see it here. How to investigate?
MRST have produced a set of PDFs derived from a fit without low-x data called MRST03 ‘conservative partons’. These give VERY different predictions for W/Z production to those of the ‘standard’ PDFs. Z W+ W- MRST02 W+ Z W- MRST03 This is what we’d have predicted if there had been no HERA
MRST02 W+ → l+ W- → l- R = l- / l+ A = (l+ - l-) / (l+ + l-) MRST03 Differences persist in the decay lepton spectra and even in theirratio and asymmetry distributions. Could we see this? …..
MRST02 MRST02 MRST02 MRST02 MRST03 MRST03 MRST03 MRST03 Contrast the prediction of MRST2002 PDFs conventional QCD evolution with those of MRST03 which distrusts the conventional secenario for x< 5 10-3 Reconstructed e- Reconstructed e+ h h Reconstructed e+- e- Asymmetry Reconstructed e- / e+ Ratio h
Reconstructed Electron Pseudo-Rapidity Distributions (AtlFast)-Tricoli MRST02 MRST02 MRST02 MRST02 MRST03 MRST03 MRST03 MRST03 200k events of W+- -> e+- with MRST02-NLO 200k events of W+- -> e+- with MRST03-NLO generated with HERWIG 6.505 + NLO K factors (200K events of W’s is the statistics of ~ 6 Hours at LHC running at Low Luminosity) Reconstructed e- Reconstructed e+ h h Reconstructed e+- e- Asymmetry Reconstructed e- / e+ Ratio h
MRST02 MRST02 MRST02 MRST02 MRST02 MRST02 MRST03 MRST03 MRST03 MRST03 MRST03 MRST03 PT Distributions (linear scale) W- Reconstructed e- Generated e- pT (GeV) pT (GeV) pT (GeV) W+ Generated e+ Reconstructed e+ pT (GeV) pT (GeV) pT (GeV)
Note of caution. MRST03 conservative partons DO NOT describe the HERA data for x< 5 10-3 which is not included in the fit which produces them. So there is no reason why they should correctly predict LHC data at non-central y, which probe such low x regions. More likely: if DGLAP at low Q2 works well due to a conspiracy between an underlying steeper gluon density and a damping non-perturbative effect then the gluon density at low-x at LHC scales could be even steeper than current predictions and so the W+ rapidity spectra would be even more ‘batman’ shaped What is really required is an alternative theoretical treatment of low-x evolution which would describe HERA data at low-x, and could then predict LHC W/Z rapidity distributions reliably – also has consequences for pt distributions. The point of the MRST03 partons is to illustrate that this prediction COULD be very different from the current ‘standard’ PDF predictions. When older standard predictions for HERA data were made in the early 90’s they did not predict the striking rise of HERA data at low-x. This is a warning against believing that a current theoretical paradigm for the behaviour of QCD at low-x can be extrapolated across decades in Q2 with full confidence. → The LHC measurements may also tell us something new about QCD
Within the conventional DGLAP treatment of QCD evolution –there is still interest in W/Z rapidity spectra. The uncertainty on the W/Z and lepton rapidity distributions is dominated by – the uncertainties in the gluon PDF. It may at first sight be surprising that W/Z distns are sensitive to gluon parameters BUT our experience is based on the Tevatron where Drell-Yan processes can involve valence-valence parton interactions. At the LHC we will have dominantly sea-sea parton interactions at low-x And at Q2~MZ2 the sea is driven by the gluon- which is far less precisely determined for all x values Measurement of W → lepton rapidity distribution can increase our knowledge of the gluon PDF useful for many other measurements HOW ACCURATE DO WE NEED TO BE?
Compare W- -> e- Rapidity Distributionsat Generator Level for different PDFs using Herwig CTEQ61 MRST02 W- -> e- W- -> e- h h Error boxes are the full PDF Uncertainties From LHAPDF eigenvectors At y=0 the total uncertainty is ~ ±6% from ZEUS ~ ±4% from MRST01E ~ ±8% from CTEQ6.1 e.g.Shift in central value from ZEUS to MRST01 is ~5% -SO we NEED to be more accurate than this → ~3% ZEUS02 W- -> e- h
Compare W+ -> e+ Rapidity Distributions at Generator Level for different PDFs using Herwig CTEQ61 MRST02 W+ -> e+ W+ -> e+ h h Error boxes are the full PDF Uncertainties ZEUS02 W+ -> e+ h h
CTEQ61 CTEQ61 CTEQ61 MRST02 MRST02 MRST02 ZEUS02 ZEUS02 ZEUS02 MRST03 MRST03 MRST03 CTEQ61 ZEUS02 MRST03 MRST02 Ratios and Asymmetry at Generator Level (Herwig) W- / W+ Ratio W+ - W- Asymmetry Error boxes are the full PDF Uncertainties h h e+ - e- Asymmetry e- / e+ Ratio h h
Statistics is not the problem How about experimental systematics? – work in progress…. ATLAS fast detector simulation: Atlfast • Electron Identification and smearing: 1) smearing of the four-momenta of the final state particles to mimic momentum dependent detector resolution 2) acceptance criteria: |h| < 2.5 (tracker acceptance region) Pt > 5 GeV 3) isolation criteria……. Background estimation Charge misidentification Misalignment
Event Selection Criteria for W+- ->l+-nl Atlas TDR Cross section for pp→W+X with W→lν, l=e,μ is ~30 nb (10 time larger than Tevatron) 300M evts/y at low Lumi. • Electrons and Muons: Pt > 25 GeV |η| < 2.4 • Missing Et > 25 GeV • To reject QCD bkg: No reconstructed jets in the event with Pt > 30 GeV Recoil on transverse plane should satisfy |u|< 20 GeV _ Cuts acceptance ~25% Assuming Lepton reconstruction efficiency ~ 90% & identification efficiency ~ 80% Total Selection Efficiency ~20% 60 M W’s/y al low Lumi. (10 fb-1)
CTEQ61 (MC@NLO) MRST02 (MC@NLO) ZEUS02 (MC@NLO) MRST03 (Herwig+k-Factors) ATLAS Detector Simulation: AtlFast e+ e- • Error boxes are the full PDF Uncertainties • From LHAPDF eigenvectors • At y=0 the total uncertainty is • ~ ±6% from ZEUS • ~ ±4% from MRST01E • ~ ±8% from CTEQ6.1 • Shift in central value from ZEUS to MRST01 is ~5% • SO we NEED to be more accurate than this → ~4% • And even more so for an asymmetry measurement ~2% ratio asymmetry
Study the effect of including the W Rapidity distributions in global PDF Fits by how much can we reduce the PDF errors? Generate data with CTEQ6.1 PDF, pass through ATLFAST detector simulation and then include this pseudo-data in the global ZEUS PDF fit. Central value of prediction shifts and uncertainty is reduced BEFORE including W data AFTER including W data W+ to lepton rapidity spectrum data generated with CTEQ6.1 PDF compared to predictions from ZEUS PDF AFTER these data are included in the fit W+ to lepton rapidity spectrum data generated with CTEQ6.1 PDF compared to predictions from ZEUS PDF Specifically the low-x gluon shape parameter λ, xg(x) = x –λ , was λ = -.187 ± .046 for the ZEUS PDF before including this pseudo-data It becomes λ = -.155 ± .03 after including the pseudodata
The steep behaviour of the gluon is deduced from the DGLAP QCD formalism – BUT the steep behaviour of the low-x Sea can be measured from F2 ~ x -λs, λs = d ln F2 d ln 1/x • Small x is high W2, x=Q2/2p.q . Q2/W2. At small x • б(γ*p) = 4π2 F2/Q2 • F2 ~ x –λs → б (γ*p) ~ (W2)λs • Buts(g*p) ~ (W2) -1 – is the Regge prediction for high energy cross-sections • is the intercept of the Regge trajectory =1.08 for the SOFT POMERON Such energy dependence is well established from the SLOW RISE of all hadron-hadron cross-sections - including s(gp) ~ (W2) 0.08 for real photon- proton scattering Does the steeper rise of б (γ*p)require a hard Pomeron? What about the Froissart bound? Could hadron-hadron cross-sections at high energies rise more steeply then we think- what about minimum bias/underlying events?
Study the effect of including the W Rapidity distributions in global PDF Fits by how much can we reduce the PDF errors? Generate W distributions with ZEUS02 PDFs- compare to current level of uncertainty e+ e- Data at generator level plus cuts, no smearing Including this generated data in the ZEUS PDF fit – reduces the PDF uncertainties , →particularly low-x gluon parameter xg(x) = x –λ , λ = -.187 ± .046 becomes λ = -.184 ± .029 Error on low-x gluon parameter reduced by ~35% e+ e-
Generate W distributions with CTEQ6.1 PDFs- compare to ZEUS02 predictions e+ e- Data at generator level plus cuts, no smearing Central values are different Include this generated data in the ZEUS PDF fit – and it shifts the central values of the ZEUS gluon PDFas well as reducing the PDF uncertainties low-x gluon parameter xg(x) = x –λ , λ = -.187 ± .046 becomes λ = -.165 ± .029 – shifted by 12% e+ e-
Finally generate W distributions with CTEQ6.1 PDFs- pass through ATLFAST detector simulation and correct simulated data from Detector level to Generator level using a different PDF- ZEUS02 e+ e- Data at ATLFAST detector level + correction Include this generated data in the ZEUS PDF fit – and it shifts the central values of the gluon PDFas well as reducing the PDF uncertainties low-x gluon parameter xg(x) = x –λ , λ = -.187 ± .046 Becomes λ = -.155 ± .03 BUT the convolution of ATLFAST Detector Smearing and PDF choice for the corrections introduces a change in this parameter of ~ 4% e+ e-
HERWIG+k-Factors HERWIG+k-Factors MC@NLO MC@NLO HERWIG+k-Factors MC@NLO HERWIG+k-Factors MC@NLO Ratios and Lepton Asymmetry for MC@NLO compared to Herwig withCTEQ61 W- / W+ Ratio W+ - W- Asymmetry yW yW e- / e+ Ratio e+ - e- Asymmetry h h
CTEQ61 Generated CTEQ61 Re-weighted from MRST02 Comparison between Generated and Re-weightedW Rapidity Distributions with CTEQ61 Events generated with HERWIG+MRST02 and re-weighted with CTEQ61 are compared to Events generated with HERWIG+CTEQ61 All distributions are At Generator Level W+ W- yW yW W- -> e- W+ -> e+ h h
MRST02 MRST02 MRST02 MRST02 MRST02 MRST02 MRST03 MRST03 MRST03 MRST03 MRST03 MRST03 PT Distributions (log scale) W- Generated e- Reconstructed e- <pt>mrst02=41.11±0.06 <pt>mrst02=34.05±0.06 <pt>mrst02=23.52±0.08 <pt>mrst03=25.69±0.09 <pt>mrst03=41.66±0.06 <pt>mrst03=34.62±0.06 pT (GeV) pT (GeV) pT (GeV) W+ Generated e+ Reconstructed e+ <pt>mrst02=23.76±0.07 <pt>mrst02=41.37±0.05 <pt>mrst02=32.28±0.06 <pt>mrst03=26.17±0.08 <pt>mrst03=33.51±0.06 <pt>mrst03=41.77±0.05 pT (GeV) pT (GeV) pT (GeV)