Download
1 / 51
510 likes | 511 Views
Explore the water cycle in Mexico City, from its ancient Aztec roots to the modern challenges of water supply and quality. Discover the impacts of excessive water demand and the effects of soil subsidence on infrastructure and the environment.

E N D
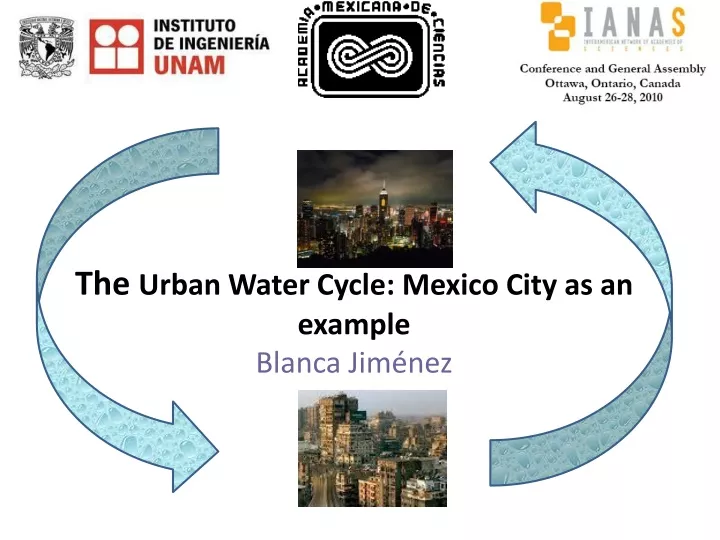
The Urban Water Cycle: Mexico City as an exampleBlanca Jiménez
Mexico City • Tenochtitlan was founded by the Aztecs in 1325 dC • In a SAFE Place and plenty with water • BUT that meant that the Mexico Valley was an endorreic basin at 2,240 masl
The Spanish arrived, in 1519 d.C. • Tenochtitlan was a “Megacity” • 200,000 inhab. • Four streets (dikes) communicated it with land and separated 5 lakes • The Spanish people • Did not understand the functioning and destroyed dikes • Rivers were used as sewers • Since then both lack of water and floods are the main urban water problems Tenochtitlan was the most important city and was an island
Mexico City in 2010 • 21,000,000 million people • Metropolitan area = the Federal District (Tenochtitlan) + 37 adjoining municipalities • Water is managed independently in the 38 entities • In total, 85.7 m3/s (7.4 MILLIONS m3/d) • 48% through the network • 44% directly pumped by the water works utilities, farmers and industries from the local water • 8%, reused treated wastewater
WATER SUPPLY AND USE • First use water (78 m3/s) comes from : • 73% from 1,965 wells located within the City • 1% from local rivers • 7% from the Lerma (100 km far and 300 m above the Mexico City level ) • 19% from the Cutzamala river (130 km away and 1,100 m) 3.4 times the Eiffel Tour Height
Water Uses • 74% municipal and industries branched to the city network • 16% irrigation (40,000 ha on the Valley) • 2% self supplied industries • 8% non drinking water reuse
Water supply service • 89% coverage , i.e., 2.3 million people receive water through water tanks • They pay 10 times the network water price • The rest, receive water through the network • BUT they receive it intermittently • Poor quality • As consequence each house has their “own storage (TINACOS) and pumping systems and potabilize water
Water sources quality • Local groundwater quality is increasingly deteriorating • Due to overexploitation, uncontrolled non source point pollution, and industrial and municipal discharges -
Water quality and drinking water sources In groundwater: In the western part (uncontrolled dumping sites used to exist) • High content of a wide variety of organic compounds (even vitamin B) - In the southwest • High Fe and Mn content - In the South (no sewer and 500,000 septic tanks discharging sewage to a volcanic soil • Nitrates, ammoniacal nitrogen and fecal coliforms
To potabilize water • Chlorination for groundwater sources and Alum coagulation, sedimentation and chlorination for surface water • Processes selected based on characteristics measured 30-40 years ago, i.e., pollutants of concern are not remove • In chlorinated water • THM (Trihalomethanes, carcinogenic) • 84 microorganisms of 9 genera associated with human fecal pollution (Streptococcus, Helicobacter pylori -associated gastric ulcers and cancer and coliphages MS-2, before and even in some cases after chlorination - resistance to chlorine?)
To have potable water • Each user • Boils, apply chemical disinfectants (chlorine, iodine or silver), uses small potabilization systems (filtration with ozone or UV-light disinfection) • Potabilization cost varies between 4-10 USD/m3} • Or buys bottled water • Mexico is the 2nd consumer of bottled water • Bottled water is 240 to 10,000 more expensive than tap water • Cost represents for a family of 4 persons living on minimum wage 11-21% of its income
IMPACTS DUE TO THE EXCESIVE WATER DEMAND 1. Overexploitation • of the local aquifer at a 117% rate • As a result there is soil subsidence • sinking rates in some places up to 40 cm/year • In 1954 the problem was perceived but center had already sunk 7 m 1980 1910
2. Soil subsidence is creating • Loss of the sewage/drainage capacity (no slope or inverted slope) • 20-30 floods per year > 30 cm in height with wastewater • To recover capacity 305 million USD are being invested
Difficulties to maintain the Deep Drainage as it conveys all year round wastewater • If it fails, 400 km2 of the City center will be flooded with 1.2 m of wastewater affecting at least 4 million people.
2. Soil subsidence is creating: • Structural problems in buildings • For Mexico City Cathedral • Differential soil sinking has led to an 87 cm difference between the apse and the western bell tower in 50 years • To redress it $ 32.5 million USD were invested in 2000 • The metro (metropolitan train) rails need to be leveled each year
2. Soil subsidence is creating • Leaks in water and wastewater networks. • 40% of the water supplied is lost, amount enough to supply 3,200,000 million people with 300 L/capita (the actual supply is 153 L/d ) • Sewage leaks • Have not been evaluated
3. Due to the Water transfer from other basins At the Lerma region • which used to be a lake, fishing disappeared and people had to live off the land. • The Chapala Lake fed by the Lerma system has experienced a level decrease of 5 m. • Cutzamala region • Reduction of the amount of water available for power generation and local population • Women mazahuas movement
ATMOSPHERIC DEPOSITION • In 1998 the regular presence of gasoline and oil-derived compounds in Mexico City’s wastewater was reported. It may come from • Air pollution (3 million automobiles that “discharge” (evaporation) 82,000 tons/yr • Oil pipelines leaks • solvents used as cleaning products (77,000 tons/yr) • evaporation and leaks of unburned oil (27,000 tons/yr) domestic gas leaks • dry cleaning services • chemical industry • graphical arts.
Air pollution • The average concentration of HC in Mexico City’s air is 8.8 ppm (2 ppm in Los Angeles in the 1980s), among the compounds reported there are • Toluene, benzene and formaldehydes • formic acid (2-24 μg/m3) • acetic acid (0.5-7 µg/m3) • propionic acid (0-18 μg/m3) • close to 200 volatile organic compounds with at least 2-13 carbons have been identified • alkenes (52-60%) • aromatic compounds (14-19%) • olefins (9-11%) • oxygenated compounds (1-2%) • MTBE Automobiles also produce • 19,889 tons of < 10 micron particles, • 22,466 tons of SO2 • 1,768,836 tons of CO • 205,885 tons of NOx • 465,021 tons of hydrocarbons
SOLID WASTES FROM SEWERS • Mexico City sewer system is VERY BIG and COMPLEX • The Sewer system is cleaned each year • 2.8 million cubic meters of sludge/solids wastes are produced
Wastes go to the ONLY municipal landfill that is already overloaded • Sediments contain • 3-7 log faecal coliforms MPN/g TS • 2-7 log Salmonella MPN/g TS • 4-21viable helminth ova /g TS • 89-7955 total petroleum hydrocarbons (mg/kg TS) • heavy metal • organic matter, nitrogen and phosphorus • Similar problems in Sao Paulo and Taiwan have been reported
Sewerage system, History • 3 artificial exits built to drain waste and pluvial water • In total, Mexico City produces 67.7 m3/s of wastewater • 11% is treated and reused since 1956 • The rest, (60 m3/s, mean conditions but varying from 52 to > 300 m3/s) IS non TREATED ANDALSO RESUED since 1896 for irrigation of the Tula Valley • 100% OF WASTEWATER REUSE
Reuse is for • 54% refill recreational lakes, • 31% green areas irrigation (6,500ha), • 5% car washing and fountains • Environmental restoration, • 8% industrial uses (Cooling)
The Tula Valley, Description • Semiarid area • Pluvial precipitation: 525 mm (5 months per year) • evaporation rate: 1,750 mm • Original vegetation: Xerophila scrubs, such as mezquite, sweet acacia, yucca and a wide variety of cacti • 1930-40s the Government was thinking on moving people, there was NO water for development
The biggest WW irrigated district in the world • From s 14,000 ha inn 1926 it reached of 90,000 ha in four irrigation districts • Among the most productive ones¡¡¡
Health effects Data used by WHO (1989 and 2006) to establish the criteria to reuse wastewater for agricultural irrigation To be controlled with a WWTP (under construction) Cifuentes et al., 1992
Secondary effect • Discovered in 1995 • At least 25 m3/s of wastewater used to irrigate were infiltrated to the local aquifer (13 times the natural recharge) • Due to • wastewater transportation in hundreds of unlined channels, • storage in unlined dams, • high irrigation rates (1.5-2.2 m/ha.yr) to wash out salts • As a result • the Tula River flow (partially fed from the aquifer) increased from 1.6 m3/s to more than 12.7 m3/s between 1945 and 1995 • the water table rose from 50 m below the ground level in 1940 to form artesian wells with flows varying from 40 to 600 L/s in 1964 • The new water sources • Are used to supply 500,000 inhabitants after only chlorination
Groundwater and drinking water quality • In 1938, a change in the water quality of wells began to be noticed • In 1995 it was officially acknowledged that • infiltrated wastewater was the origin of the new water sources • It was the as supply for 500,000 inhab • Several studies to assess the water quality begun
Results • No main problems • Water was light saline • In wells built with no care some microbiological problem Why not using it for Mexico City supply?
Future water demand • Option to supply this demand • Transferring water from other basins and/or • Aggressive water reuse programs • On site wastewater potabilization OR • Returning back groundwater from the Mezquital Valley
Cost comparison of different new water source options for Mexico City (Jiménez and Chavez, 2004)
Excessive water demand in a limited area -Water efficient Use - Water Reuse - Urban Growiing balnace with the local water availability Transportation of polluted water in open channels or rivers - Specially in poor periruban areas Infiltrate or discharge into water Industrial non point sources discharges • Handling of liquid courses • DICHARGING AND TRANSPORTING DO NOT GET RID OF POLLUTION Atmospheric deposition • Air pollutants by direct deposition or settling are transfer to and water. AIR POLLUTION CONTROL Dumping sites, municipal landfills and hazardous waste confinement sites • Especially old landfills (<1970’s) • Emerging pollutants sources • SURVEILLANCE, TRACKING AND CONTROL Non intentional Reuse of treated and non treated wastewater Reintegrating used water concept rather than disposal concept and solid products wastes • Infiltration wells as wastewater disposal option • BETTER SURVEILLANCE OF THE WASTES MANAGEMENT IN INDUSTRIES; CLEANER> PRODUC TION CONCEP AND SOCIAL ENVIRONMENTAL RESPONSIBILITY APPRAOCH Treated wastewater disposal • During the dry season 70% of the water supply in the Tamesis river (England) comes from WWTP effluents • THE WAY IN WHICH WTP ARE CONCEIVE NEED TO CHANGE TO CLOSE THE WATER LOOP • Urban Septic tanks • Discharge partially treated wastewater • In Sana’a, Yemen represent 80% of the urban recharge • NEW SOLUTIONS FOR ON SITE TREATMENT Leaks in the water network From 8-60% MAINTENANCE OF URBANINFRASTRUCTURE Sewers: Infiltration As high as 500 mm/yr in highly populated urban areas SEWERS MAINTENANCE Subsurface storage tanks ( gasoline, oil or chemical compounds) leak Especially if they are > 20 years old MONITORING AND MAINTENANCE PROGRAM • Storage or treatment Tanks/Ponds (containing wastewater, industrial liquid wastes , or stormwater) frequently leak • Even if waterproofed, infiltration occurs (10-20 mm/d) • MONITOR AND CONTROL OF NON POINT URBAN DISCHARGES TO SOIL AND GROUNDWATER
CONCLUSIONS • Mexico City is one example, but there are many other (similar or parts, developedn and developing) • Cities need water (in appropriate quantity and quality) • They modify the water cycle in many ways • Impacts often are overlooked putting at risk cities and the “urban water” sustainability • To control such impacts • causes need first to be acknowledge and identified • appropriate and affordable measures should be put in place • For both the hydrological urban water cycle concept is useful and to study it inter/transdiciplinary effort need to be made
Water NetworkIANAS Dr. José Galizia Tundisi Dra Blanca E Jiménez Cisneros
IANAS Water Programme • (a) establish National Water Committees that will help Academies provide advice to governments and society, thus enhancing their social relevance; • (b) prepare white papers providing a strategic view on national water resources; • (c) implement capacity building activities; • (d) discuss new perspectives and innovative solutions for water management; • (e) set the stage for the future publicizing and implementation of the recommendations of the IAC Study Panel on Water.
Meeting in Domingo, 29 February to 01 March 2008 • Argentina, Raul Lopardo • Bolivia, Fernando Urquidi • Venezuela, Ernesto Gonzalez • Brazil, Jose GaliziaTundisi • Canada, Keith Hipel • Cuba, Mercedes Arellano Guatemala, Manuel Basterrechea Haiti, Wilson Celestin Nicaragua, Katherine Vammen Peru Adolfo Toledo and Axel Dourojeani Dominican R., Rafael Osiris de Leon Trinidad & Tobago, Vincent Cooper United States, Henry Vaux
Water in X COUNTRY , Book • Water Resources • Water and sustainable development • Climate Change and Water • Groundwater/Ecohidrology • Water Quality • Water and ecosystems • Limnology • Water and Health • Water Services for Municipalities • Water, Livestock and Agriculture • Water and industry • Urban Water • Water and Ecotourism • Water and Energy • Water and Transportation • Aquaculture • Hydroeconomy • Institutional and Legal Framework • Water and Women • Public Participation NEXT STEP