Download
1 / 69
690 likes | 695 Views
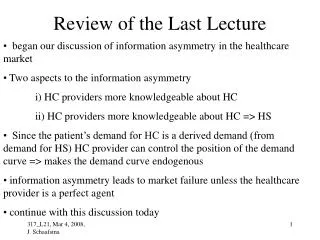
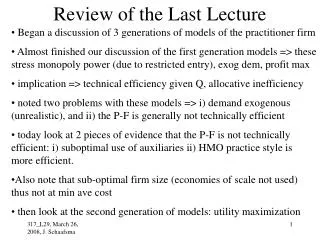
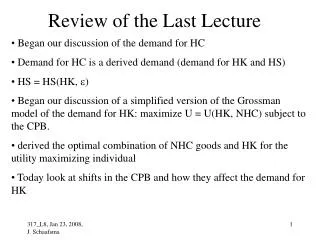
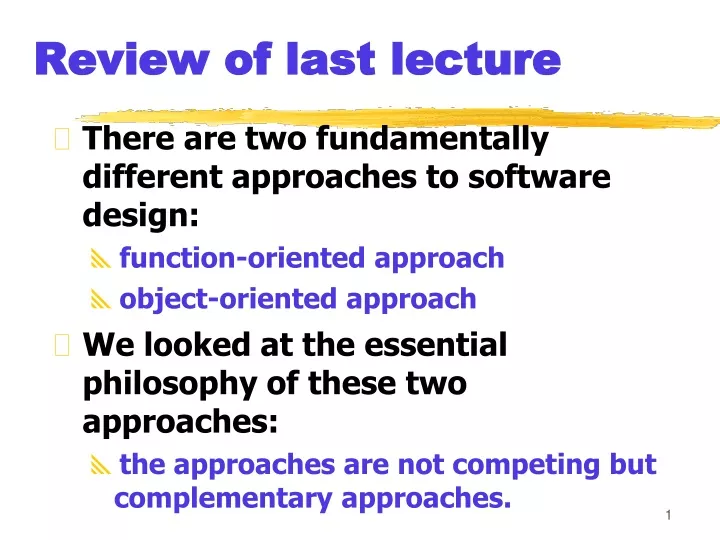
Review of last lecture. There are two fundamentally different approaches to software design: function-oriented approach object-oriented approach We looked at the essential philosophy of these two approaches: the approaches are not competing but complementary approaches. Introduction.

E N D
Review of last lecture • There are two fundamentally different approaches to software design: • function-oriented approach • object-oriented approach • We looked at the essential philosophy of these two approaches: • the approaches are not competing but complementary approaches.
Introduction • Function-oriented design techniques are very popular: • currently in use in many software development organizations. • Function-oriented design techniques: • start with the functional requirements specified in the SRS document.
Introduction • During the design process: • high-level functions are successively decomposed: • into more detailed functions. • finally the detailed functions are mapped to a module structure.
Introduction • Successive decomposition of high-level functions: • into more detailed functions. • Technically known as top-down decomposition.
Introduction • SA/SD methodology: • has essential features of several important function-oriented design methodologies --- • if you need to use any specific design methodology later on, • you can do so easily with small additional effort.
Overview of SA/SD Methodology • SA/SD methodology consists of two distinct activities: • Structured Analysis (SA) • Structured Design (SD) • During structured analysis: • functional decomposition takes place. • During structured design: • module structure is formalized.
Functional decomposition • Each function is analyzed: • hierarchically decomposed into more detailed functions. • simultaneous decomposition of high-level data • into more detailed data.
Example (Functional decomposition) • For example, consider a function create-new-library-member which essentially creates the record for a new member, assigns a unique membership number to him, and prints a bill towards his membership charge. • This function may consist of the following sub-functions: • create-member-record • assign-membership-number • print-bill
Structured analysis • Transforms a textual problem description into a graphic model. • done usingdata flow diagrams (DFDs). • DFDs graphically represent the results of structured analysis.
Structured design • All the functions represented in the DFD: • mapped to a module structure. • The module structure: • also called as the software architecture:
Detailed Design • Software architecture: • refined through detailed design. • Detailed design can be directly implemented: • using a conventional programming language.
Data flow diagrams • DFD is an elegant modelling technique: • useful not only to represent the results of structured analysis • applicable to other areas also: • e.g. for showing the flow of documents or items in an organization, • DFD technique is very popular because • it is simple to understand and use.
Data flow diagram • DFD is a hierarchical graphical model: • shows the different functions (or processes) of the system and • data interchange among the processes.
Data Flow Diagram Definition • It is a structured, diagrammatic technique representing external entities, logical storage, and data flows in the system.
DFD Concepts • It is useful to consider each function as a processing station: • each function consumes some input data and • produces some output data.
Data Flow Diagram Principles 1. A system can be decomposed into subsystems, and subsystems can be further decomposed into lower level subsystems. 2. Each subsystem represents a process or activity in which data is processed. 3. At the lowest level subsystem, processes can no longer be decomposed. 4. A process must have input and output. 5. Data flows between processes within the system and data is produced as output from the system.
Data Flow Diagrams (DFDs) • A DFD model: • uses limited types of symbols. • simple set of rules • easy to understand: • it is a hierarchical model.
Data Flow Diagrams (DFDs) • Primitive Symbols Used for Constructing DFDs:
External Entity Symbol • Represented by a rectangle • External entities are real physical entities: • input data to the system or • Output produced by the system. • Sometimes external entities are called terminator, source, or sink. Librarian
Function (process) Symbol • A function such as “search-book” is represented using a circle: • This symbol is called a processor bubbleor transform. • Bubbles are annotated with corresponding function names. • Functions represent some activity: • function names should be verbs. search-book
Data Flow Symbol book-name • A directed arc or line. • represents data flow in the direction of the arrow. • Data flow symbols are annotated with names of data they carry.
Data Store Symbol • A data store represents either a temporary or permanent place where the data comes to rest. • Represents a logical file: • A logical file can be: • a data structure • a physical file on disk. • Each data store is connected to a process: • by means of a data flow symbol. book-details
DFD Naming Guidelines • External Entity Noun • Data Flow Names of data • Process verb phrase • a system name • a subsystem name • Data Store Noun
Data Flow Model of a Car Assembly Unit Engine Store Door Store Chassis with Engine Partly Assembled Car Fit Doors Fit Wheels Paint and Test Fit Engine Assembled Car Car Chassis Store Wheel Store
Synchronous operation • If two bubbles are directly connected by a data flow arrow: • they are synchronous Read-numbers0.1 Validate-numbers0.2 number Valid number Data-items
Asynchronous operation • If two bubbles are connected via a data store: • they are not synchronous. Read-numbers0.1 Validate-numbers0.2 numbers Valid number Data-items
Yourdon's vs. Gane Sarson Notations • The notations that we would be following are closer to the Yourdon's notations • You may sometimes find notations in books that are slightly different • For example, the data store may look like a box with one end closed
How is Structured Analysis Performed? • Initially represent the software at the most abstract level: • called the context diagram. • the entire system is represented as a single bubble, • this bubble is labelled according to the main function of the system.
Tic-tac-toe: Context Diagram Tic-tac-toe software display move Human Player
Data Flow Diagram Levels • A Data Flow Diagram can be subdivided into several levels where the Lowest level(abstract level) is known as the context level or top-level. • Each level can further be decomposed into subsystems until all of the processes and subsystems are identified.
Context Diagram • A context diagram shows: • data input to the system, • output data generated by the system, • external entities.
Context Diagram • Context diagram captures: • various entities external to the system and interacting with it. • data flow occurring between the system and the external entities. • The context diagram is also called as the level 0 DFD.
Context Diagram • Context diagram • establishes the context of the system, i.e. • represents: • Data sources • Data sinks.
Ex-1:Context diagramof DFD for Grading System Final grades Register’s office Student Grading system OMR Card Final grades Current score Final score Teacher Context diagramis an overview of an organisational system that show the system boundaries, external entities that interact with the system, and the major information flows between the entities and the system
Level 1 DFD • Examine the SRS document: • Represent each high-level function as a bubble. • Represent data input to every high-level function. • Represent data output from every high-level function.
Higher level DFDs • Each high-level function is separately decomposed into subfunctions: • identify the subfunctions of the function • identify the data input to each subfunction • identify the data output from each subfunction • These are represented as DFDs.
Decomposition • Decomposition of a bubble: • also called factoring or exploding. • Each bubble is decomposed to • between 3 to 7 bubbles.
Decomposition • Too few bubbles make decomposition superfluous: • if a bubble is decomposed to just one or two bubbles: • then this decomposition is redundant.
Decomposition • Too many bubbles: • more than 7 bubbles at any level of a DFD • make the DFD model hard to understand.
Decompose how long? • Decomposition of a bubble should be carried on until: • a level at which the function of the bubble can be described using a simple algorithm.
Example 1: RMS Calculating Software • Consider a software called RMS calculating software: • reads three integers in the range of -1000 and +1000 • finds out the root mean square (rms) of the three input numbers • displays the result.
Example 1: RMS Calculating Software • The context diagram is simple to develop: • The system accepts 3 integers from the user • returns the result to him.
Example 1: RMS Calculating Software Compute- RMS0 Data-items User result Context Diagram
Example 1: RMS Calculating Software • From a cursory analysis of the problem description: • we can see that the system needs to perform several things.
Example 1: RMS Calculating Software • Accept input numbers from the user: • validate the numbers, • calculate the root mean square of the input numbers • display the result.
Example 1: RMS Calculating Software numbers Read-numbers0.1 Validate-numbers0.2 Valid -numbers Data-items error Compute-rms0.3 Display0.4 result RMS
Example 1: RMS Calculating Software Squared-sum Calculate-squared-sum0.3.1 Calculate-mean0.3.2 Valid -numbers Mean-square Calculate-root0.3.3 RMS
Example: RMS Calculating Software b a c Square0.3.1.2 Square0.3.1.3 Square0.3.1.1 bsq asq csq Sum0.3.1.4 Squared-sum
Example: RMS Calculating Software • Decomposition is never carried on up to basic instruction level: • a bubble is not decomposed any further: • if it can be represented by a simple set of instructions.