Download
1 / 12
120 likes | 123 Views
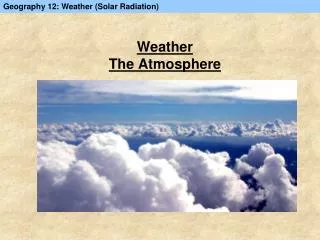
Weather Condition of the atmosphere at any particular time and place Air temperature, air pressure, humidity, clouds, precipitation, visibility, wind Climate Accumulation of daily and seasonal weather events over a long period of time “Average weather”.

E N D
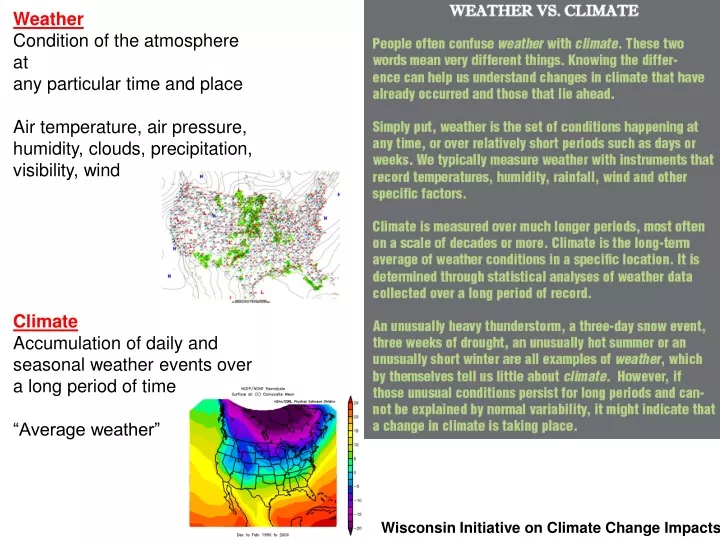
Weather Condition of the atmosphere at any particular time and place Air temperature, air pressure, humidity, clouds, precipitation, visibility, wind Climate Accumulation of daily and seasonal weather events over a long period of time “Average weather” Wisconsin Initiative on Climate Change Impacts 2011
What is the Greenhouse Effect? Both Good and Bad Earth: 400 ppm CO2 Venus: 965,000 ppm CO2 Venus: 460C, hotter than Mercury, despite 1/4 of solar irradiance
Which is the most abundant greenhouse gas on Earth? National Center for Atmospheric Research
Primary greenhouse gases: • Water vapor (#1) (<1 year) • Carbon dioxide (100s years) • Methane (10 years) • Nitrous oxide (100 years) • Ozone (<1 year) • Hydrofluorocarbons (1000s years) • Chlorofluorocarbons (100s years) National Center for Atmospheric Research
Year 2000 #2 #1 #3 Global warming art
Atmospheric Levels of Methane Atmospheric Levels of Carbon Dioxide Concentrations are increasing Pre-Industrial Era ≈ 280 ppm June 2014 ≈ 400 ppm (keelingcurve.ucsd.edu) Accelerated trend 1959-1963: +0.76 ppm/year 2009-2013: +2.18 ppm/year Note the distinct seasonal cycle: “Breath of the biosphere” Fifth Assessment Report of the Intergovernmental Panel on Climate Change (IPCC AR5); NOAA; Florida Center for Environmental Studies
Absorption Spectrum: Amount of Radiation Absorbed at a Given Wavelength ULTRAVIOLET (Shortwave) INFRARED (Longwave) VISIBLE Not absorbed Absorbed Not absorbed Greenhouse gases primarily absorb longwave (infrared) radiation Fleagle & Businger
Some of the infrared radiation passes through the atmosphere but most is absorbed and re-emitted in all directions by greenhouse gas molecules and clouds. The effect of this is to warm the Earth’s surface and the lower atmosphere (IPCC AR4 WG1). Greenhouse Effect Sun = hot = emits shortwave (UV) radiation Shortwave Longwave Greenhouse gases Earth = cool = emits longwave (IR) radiation Wien’s Law: Wavelength inversely related to temperature
Global carbon emissions from burning coal, oil, and gas and producing cement during 1850-2009. These emissions account for about 80% of the total emissions of carbon from human activities, with land-use changes accounting for the other 20%. Human-induced changes in the global carbon budget since the beginning of the Industrial Revolution. Emissions from fossil fuel burning are the dominant cause of the steep rise from 1850 to 2012. National Climate Assessment; Global Carbon Project; Boden et al. 2012
European Union 13% U.S. 17% Carbon dioxide emissions China 26% China 26% U.S. 17% European Union 13% Climate change is an ethics issue Predicted mortality for 2000-2030 due to malaria, malnutrition, diarrhea, flooding related to climate change Patz et al. 2007
Note the distinct interannual and decadal variability, in addition to the long-term trend Each decade is subsequently warmer “Each of the last three decades has been successively warmer at the Earth’s surface than any preceding decade since 1850. In the Northern Hemisphere, 1983-2012 was likely the warmest 30-year period of the last 1400 years.” – IPCC AR5 “The globally averaged combined land and ocean surface temperature data….show a warming of 0.85°C over the period of 1880-2012.” – IPCC AR5 IPCC AR5
Claim: But this last winter was brutally cold, so global warming is not happening. Histogram of surface air temperature anomalies (°C) during December 2013 – April 2014 for all global grid cells During those 5 months, 66% of the world was warmer than normal and only 34% was colder than normal. Surface air temperature anomalies (°C) during December 2013 – April 2014 Only cold over central North America….most other places in the world were warm, especially the Arctic.