Download
1 / 9
210 likes | 956 Views
Graphing Boyle’s Law. The relationship between pressure and volume is inversely proportional: when one goes up the other goes down. Pressure and Temperature.

E N D
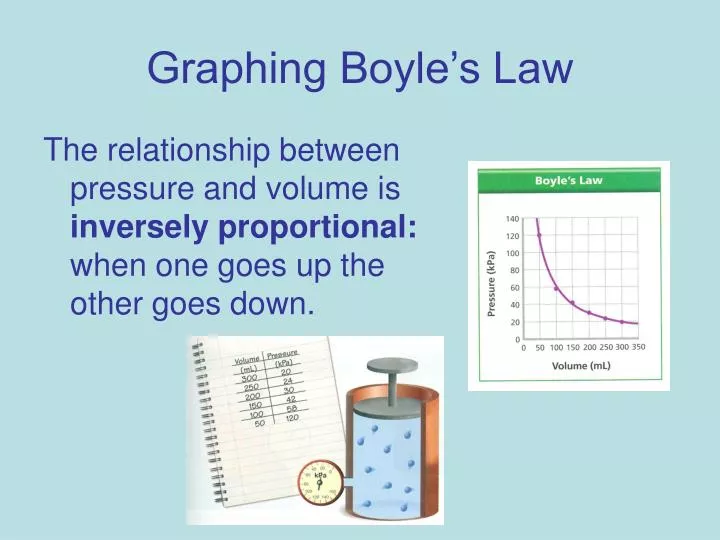
Graphing Boyle’s Law The relationship between pressure and volume is inversely proportional: when one goes up the other goes down.
Pressure and Temperature When a gas is heated, the particles move faster and collide more often with each other and with the walls of their container. The pressure of the gas increases.
Graphing Gas Behavior In an experiment, the temperature of a gas at a constant volume was varied. Gas pressure (in kilopascals) was measured after each 5-kelvin change in temperature. The data from the experiment are shown in the table.
Graphing Gas Behavior Graphing Use the data to make a line graph. Plot temperature on the horizontal axis with a scale from 270 K to 300 K. Plot pressure on the vertical axis with a scale from 0 kPa to 25 kPa. (1 kPa = 1,000 Pa)
Graphing Gas Behavior Interpreting Data What was the manipulated variable in this experiment? Changing the temperature of a gas at constant volume changes its pressure in a similar way.
Graphing Gas Behavior Interpreting Data What kind of trend do the data show? Pressure increases with temperature.
Graphing Gas Behavior Drawing Conclusions What happens to the pressure of a gas when temperature is increased at constant volume? Gas pressure increases.
Gas Laws Activity • Click the Active Art button to open a browser window and access Active Art about gas laws.