Download
1 / 18
180 likes | 332 Views
Disparities in Cancer. September 22, 2008. Introduction. Despite notable advances in cancer prevention, screening, and treatment, a disproportionate number of the uninsured, minorities, and other medically underserved populations are still not benefiting from such important progress.

E N D
Disparities in Cancer September 22, 2008
Introduction • Despite notable advances in cancer prevention, screening, and treatment, a disproportionate number of the uninsured, minorities, and other medically underserved populations are still not benefiting from such important progress. • Underlying causes of cancer disparities are interrelated and complex. • Causes of cancer disparities can be linked to social, behavioral, and economic factors such as • persistent inequalities in access to care, • language barriers • unhealthy environments • racial discrimination
Unequal progress can also increase disparities.At the same time that exposure to environmental tobacco smoke decreased, disparities have increased. 1988-94 1999-2000 Age-adjusted percent with detectable serum cotinine, age 4 and older Mexican American Black, non-Hispanic White, non-Hispanic I 95% confidence interval * Nonsmokers defined by serum cotinine levels < 11 ng/mL. **Detectable serum cotinine levels: > .05 ng/mL and < 10 ng/mL. Notes: Age adjusted to the 2000 standard population. Data for other Hispanics, American Indians,/Alaska Natives, Asians/Pacific Islanders are unreliable. 3 Source: National Health and Nutrition Examination Survey (NHANES), NCHS, CDC.
Having insurance makes a difference. Uninsured persons are less likely than privately insured persons to receive timely cancer screenings. Percent Mammogram in Past Two Years, 2005 Received recommended colorectal cancer screening in past 10 years, 2005 Pap Test in Past Three Years, 2005 Women, 40-64 Women, 18-64 Adults, 50-64 4 SOURCES: Ward, Elizabeth, et al. "Association of Insurance with Cancer Care Utilization and Outcomes." CA: A Cancer Journal for Clinicians 58.1 (2008): 9-31.
Health care providers can make a difference. Racial and ethnic minorities are less likely to be advised to quit smoking. Likelihood Used tobacco cessation treatments in the past year Advised to quit smoking Screened for tobacco use 5 SOURCES: Vilma 2008
Costs of care impact persons of lower socioeconomic status more. Small copays for mammography are more likely to deter lower education women from receiving mammograms. Percent Percent decrease in mammography due to copays 6 SOURCES: ayanian 2008
African Americans are more than 50% more likely than whites to be diagnosed with prostate cancer… Prostate Cancer Incidence Rates, 2004 Per 100,000 population White, Non-Hispanic Hispanic Incidence African American, Non-Hispanic Asian and Pacific Islander American Indian/Alaska Native 7 Note: Data are age adjusted to the 2000 standard population. SOURCE: National Cancer Institute, Surveillence, Epidemiology, and End Results (SEER) Program; National Vital Statistics System--Mortality, NCHS, CDC.
But African Americans are twice as likely than whites to die of prostate cancer. Prostate Cancer Death Rates, 2005 Per 100,000 population White, Non-Hispanic Hispanic Deaths African American, Non-Hispanic Asian and Pacific Islander American Indian/Alaska Native 8 Note: Data are age adjusted to the 2000 standard population. SOURCE: National Cancer Institute, Surveillence, Epidemiology, and End Results (SEER) Program; National Vital Statistics System--Mortality, NCHS, CDC.
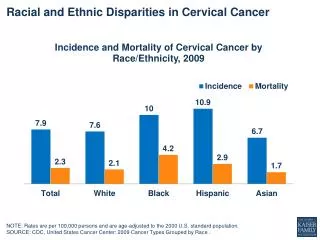
Incidence rates of breast cancer are highest in white women….. Breast Cancer Incidence Rates, 2005 Per 100,000 population White, Non-Hispanic Incidence Hispanic African American, Non-Hispanic Asian and Pacific Islander American Indian/Alaska Native 9 Note: Data are age adjusted to the 2000 standard population. SOURCE: National Cancer Institute, Surveillence, Epidemiology, and End Results (SEER) Program; National Vital Statistics System--Mortality, NCHS, CDC.
….but death rates from breast cancer are highest in African American women. Breast Cancer Death Rates, 2005 Per 100,000 population White, Non-Hispanic Hispanic African American, Non-Hispanic Deaths Asian and Pacific Islander American Indian/Alaska Native 10 Note: Data are age adjusted to the 2000 standard population. SOURCE: National Cancer Institute, Surveillence, Epidemiology, and End Results (SEER) Program; National Vital Statistics System--Mortality, NCHS, CDC.
Cancer mortality disparities vary greatly by region. For example, Blacks are more likely to die of breast cancer in Chicago than in New York City. 11
Despite progress in fighting cancer, racial disparities can grow. The difference in black and white colorectal cancer death rates is almost 50 times larger than in 1978. Colorectal Cancer Death Rates Per 100,000 population Note: Data are age adjusted to the 2000 standard population. SOURCE: National Vital Statistics System--Mortality, NCHS, CDC. 12
Having health insurance matters.Uninsured, publicly insured women are three times more likely to be diagnosed with a later stage of breast cancer than privately insured women Likelihood of being diagnosed with Stage III/IV breast cancer vs. Stage I breast cancer Private Uninsured Insurance Status Medicaid Medicare, 65+ 13 Note: Model adjusted for insurance type, race/ethnicity, age at diagnosis, income, proportion without high school degree, US census region, year of diagnosis, and facility type. SOURCE: Halpern et al, 2007
Race and ethnicity affects access to high quality treatment. Compared to whites, blacks are 50% less likely to receive appropriate treatment for breast cancer. American Indians are 70% less likely. Odds ratio of receiving inappropriate treatment White, Non-Hispanic Mexican Race/Ethnicity Black, Non-Hispanic Asian and Pacific Islander American Indian/Alaska Native 14 SOURCE: Li et al. 2003. Differences in Breast Cancer Stage, Treatment, and Survival by Race and Ethnicity. Archives of Internal Medicine. 163:49-56.
As new treatment technology is used, disparities may grow.Disparities in the receipt of sentinel node lymph biopsy by insurance status have grown as the technology has become more popular. 15 Chen et al., Journal of Clinical Oncology 2008
Blacks are less likely than whites to use hospice services prior to their deaths from cancer. Percent All P<0.001 16 Virnig et al, Med Care 2002
Conclusion • Eliminating disparities in cancer screening, diagnosis, treatment, and mortality is an essential step toward improved health outcomes for all Americans with cancer. • Reducing cancer disparities can be achieved by instituting cost-effective public health programs that promote overall wellness and save lives.