Download
1 / 8
80 likes | 178 Views
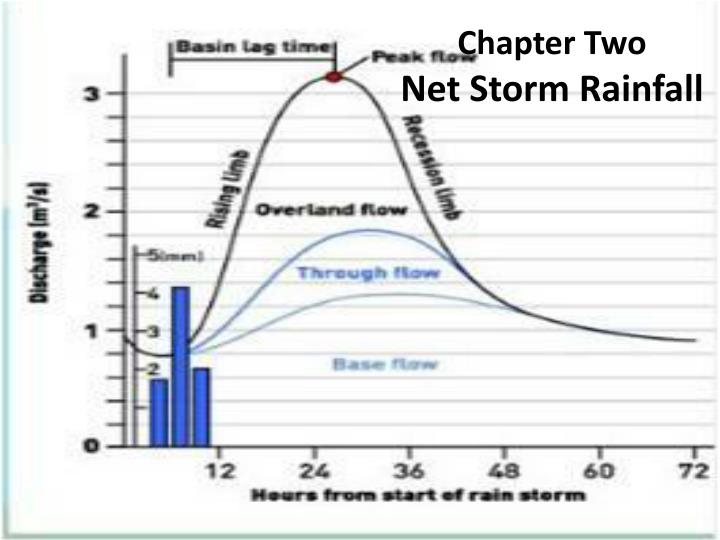
Chapter Two Net Storm Rainfall. Hydrograph Vocabulary.

E N D
Hydrograph Vocabulary • Rising limb, a falling limb, and a recession. The rising limb and falling limb are separated by the hydrograph crest, and the limbs are separated from the recession by inflection points. The rising limb is typically steeper than the falling limb. The only steady contribution to the water in a channel during dry spells is coming from subsurface flow, the base flow. During a storm, flow in the stream increases due to runoff, then gradually decreases to some minimum value. The minimum is from base flow.
Notice the hyetograph and hydrograph areas are in different scales When rainfall starts, some gets caught in retention storage depressions where it will be evaporated again, but some enters the ground (infiltration, including some from detention storage) where it will contribute to the channel flow at some later time.
Customer wants 14.25 hours, and 370 cfs converted to depth Notice the hyetograph and hydrograph areas are shown in different scales The remainder, however, begins to make its way down to the channel, causing that sharply defined rising limb. At the time of the flood crest, maximum flow reaches our outlet guage. Flow then tails off gradually with time, and eventually, all direct runoff stops. At this point groundwater takes over again—because groundwater flow is much slower than surface water, the rate of decrease abruptly slows. This marks an inflection point in the flow.
Convert the gross hyetograph to net rainfall by subtracting infiltration, f, and totaling for the storm The inflection point on the falling limb is assumed to be the point where direct runoff (DRO) ends. Notice the hyetograph and hydrograph areas are in different scales
Net Storm Rainfall Net Storm Rainfall is the portion of rainfall during a storm which reaches a stream as direct surface flow = direct runoff DRO = gross rainfall – losses (to infiltration, retention storage)Notice the F index tends to underestimate infiltration losses at the beginning of the storm and overestimates at the end.
An Example • As usual I’ll demonstrate an example, and then you will work on a similar homework problem. • See the next slide
HERE IS TODAY”S EXAMPLE PROBLEM FROM THE TEXT, 3rd and 4th editions Example 2-1 Net Storm Rainfall (done a little differently) • Average gross rainfall over a watershed is shown on the gross hyetograph (intensity vs. time, on the left). The F-index is 0.5 in/hr. The hydrograph (right) shows the flow rate response at the outlet gage. • Plot a net hyetograph. • Calculate the net storm rainfall volume as inches over the watershed area. • Replot the net hyetograph, inverted, in the upper left corner of the hydrograph. • Calculate the total volume of direct runoff, as cfs . hours, by estimating the area under the hydrograph curve with average rectangles spaced every two hours. • Convert the total volume to acre .inches, • Calculate the area of the basin.