Download
1 / 1
10 likes | 199 Views
Conditioned Latin Hypercube Sampling to Accomplish Multiple Research Objectives in the Powder River Basin, WY.

E N D
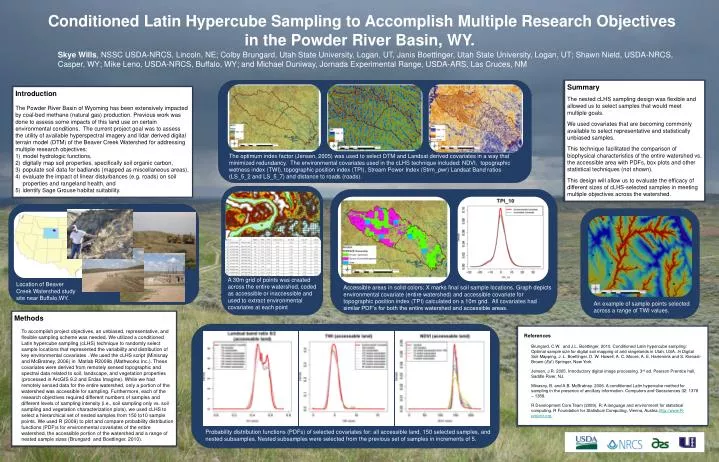
Conditioned Latin Hypercube Sampling to Accomplish Multiple Research Objectives in the Powder River Basin, WY. Skye Wills, NSSC USDA-NRCS, Lincoln, NE; Colby Brungard, Utah State University, Logan, UT, Janis Boettinger, Utah State University, Logan, UT; Shawn Nield, USDA-NRCS, Casper, WY; Mike Leno, USDA-NRCS, Buffalo, WY; and Michael Duniway, Jornada Experimental Range, USDA-ARS, Las Cruces, NM Summary The nested cLHS sampling design was flexible and allowed us to select samples that would meet multiple goals. We used covariates that are becoming commonly available to select representative and statistically unbiased samples. This technique facilitated the comparison of biophysical characteristics of the entire watershed vs. the accessible area with PDFs, box plots and other statistical techniques (not shown). This design will allow us to evaluate the efficacy of different sizes of cLHS-selected samples in meeting multiple objectives across the watershed. Introduction The Powder River Basin of Wyoming has been extensively impacted by coal-bed methane (natural gas) production. Previous work was done to assess some impacts of this land use on certain environmental conditions. The current project goal was to assess the utility of available hyperspectral imagery and lidar derived digital terrain model (DTM) of the Beaver Creek Watershed for addressing multiple research objectives: model hydrologic functions, digitally map soil properties, specifically soil organic carbon, populate soil data for badlands (mapped as miscellaneous areas), evaluate the impact of linear disturbances (e.g. roads) on soil properties and rangeland health, and identify Sage Grouse habitat suitability. The optimum index factor (Jensen, 2005) was used to select DTM and Landsat derived covariates in a way that minimized redundancy. The environmental covariates used in the cLHS technique included: NDVI, topographic wetness index (TWI), topographic position index (TPI), Stream Power Index (Strm_pwr) Landsat Band ratios (LS_5_2 and LS_5_7) and distance to roads (roads). A 30m grid of points was created across the entire watershed, coded as accessible or inaccessible and used to extract environmental covariates at each point Location of Beaver Creek Watershed study site near Buffalo,WY. Probability distribution functions (PDFs) of selected covariates for: all accessible land, 150 selected samples, and nested subsamples. Nested subsamples were selected from the previous set of samples in increments of 5. Methods To accomplish project objectives, an unbiased, representative, and flexible sampling scheme was needed. We utilized a conditioned Latin hypercube sampling (cLHS) technique to randomly select sample locations that represented the variability and distribution of key environmental covariates . We used the cLHS script (Minisnay and McBratney, 2006) in Matlab R2009b (Mathworks Inc.). These covariates were derived from remotely sensed topographic and spectral data related to soil, landscape, and vegetation properties (processed in ArcGIS 9.2 and Erdas Imagine). While we had remotely sensed data for the entire watershed, only a portion of the watershed was accessible for sampling. Furthermore, each of the research objectives required different numbers of samples and different levels of sampling intensity (i.e., soil sampling only vs. soil sampling and vegetation characterization plots), we used cLHS to select a hierarchical set of nested samples from 150 to10 sample points. We used R (2009) to plot and compare probability distribution functions (PDF)s for environmental covariates of the entire watershed, the accessible portion of the watershed and a range of nested sample sizes (Brungard and Boettinger, 2010). References Brungard, C.W. and J.L. Boettinger, 2010. Conditioned Latin hypercube sampling: Optimal sample size for digital soil mapping of arid rangelands in Utah, USA. In Digital Soil Mapping, J. L. Boettinger, D. W. Howell, A. C. Moore, A. E. Hartemink and S. Kienast-Brown (Ed.) Springer, New York. Jensen, J.R. 2005. Introductory digital image processing. 3rd ed. Pearson Prentice hall, Saddle River, NJ. Minasny, B. and A.B. McBratney. 2006. A conditioned Latin hypercube method for sampling in the presence of ancillary information. Computers and Geosciences 32: 1378 – 1388. R Development Core Team (2009). R: A language and environment for statistical computing. R Foundation for Statistical Computing, Vienna, Austria.http://www.R-project.org. An example of sample points selected across a range of TWI values. Accessible areas in solid colors; X marks final soil sample locations. Graph depicts environmental covariate (entire watershed) and accessible covariate for topographic position index (TPI) calculated on a 10m grid. All covariates had similar PDF’s for both the entire watershed and accessible areas.