Download
1 / 11
140 likes | 413 Views
Experimental Probability. Goal: to find the experimental probability of an event happening. . Experimental Probability.

E N D
Experimental Probability Goal: to find the experimental probability of an event happening.
Experimental Probability • In experimental probability, the likelihood of an event is estimated by repeating an experiment many times and observing the number of times the event happens. That number is divided by the total number of trials. • The more the experiment is repeated, the more accurate the estimate is likely to be.
To find experimental probability: number of times an event occurs total number of trials
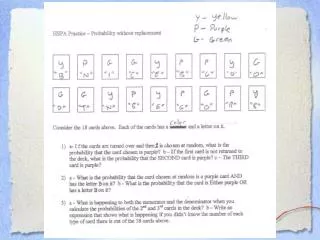
Example #1: • A marble is drawn out of a bag and then replaced. The table shows the results after 100 draws. Estimate the probability of drawing a yellow marble. number of yellow marbles drawn total number of draws
Example #2: • The table shows the results of 500 spins of a spinner. Estimate the probability of the spinner landing on 2.
Example #3: • A researcher polled 230 freshman at a university and found that 110 of them were enrolled in a history class. Estimate the probability that a randomly selected freshman is enrolled in a history class.
Example #4: • Tim has made 65 out of his last 150 free throw attempts. Estimate the probability that he will make his next free throw.
Example #5: • The table shows the results when players were up to bat. Estimate the probability of each event. • A batter hits a single • A batter hits a double • A batter hits a triple • A batter makes an out
Example #6: • A researcher has been observing cars passing through an intersection during heavy traffic. Of the last 50 cars, 21 turned left, 15 turned right, and 14 went straight. Estimate the probability that a car will turn right. • If 200 more cars came through the intersection, how many would go straight?
Example #7: • Ed polled 128 students about their favorite hobbies. • Use the table to compare the probability that a student’s favorite hobby is sports to the probability that it is reading.
Example #8: • Use the table to compare the probability that the Huskies will win their next game with the probability that the Knights will win their next game.