Download
1 / 11
110 likes | 227 Views
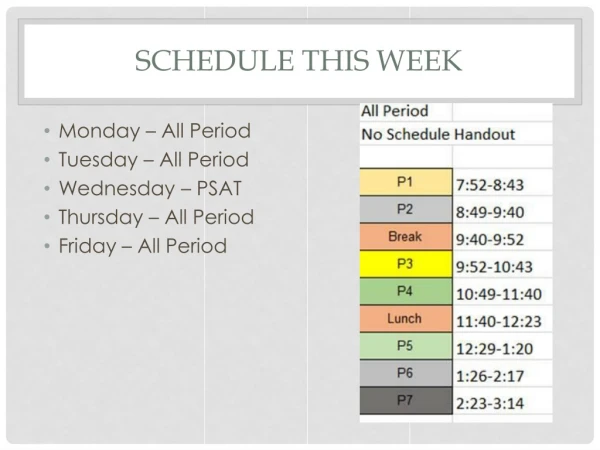
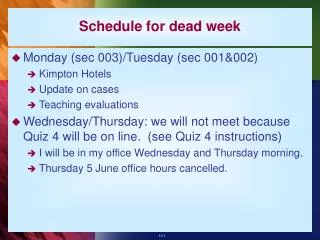
Schedule of Week 10. Project 2 is online, due by Monday, Dec 5 at 03:00 am 2. Discuss the DW test and how the statistic attains less/greater that 2 values in cases of positive/negative auto-correlation and then go over HW18-Q5 .

E N D
Schedule of Week 10 • Project 2 is online, dueby Monday, Dec 5 at 03:00 am • 2. Discuss the DW test and how the statistic attains less/greater that 2 values in cases of positive/negative auto-correlation and then go over HW18-Q5. • 3. Discuss multi-collinearity. Mention the disagreement between F and individual t-tests similar to slides. Then the |r|>0.8 for detecting the independent variables pairs we might find problematic. Also how to decide which variable we drop to cure the problem. Then do HW19-Q3.
assumptions in simple linear regression Slide 43, Page 77 in course packet. • Error term is Normal, with a mean 0, • Error term is Normal, with constant variance. • Error term is independent. (Durbin-Watson Test) • No outliers • No serious multicollinearity
Durbin-watson test • When you suspect the independence of error is violated, specifically, you think it is AR(1) AR(1): • H0: No A/C • Ha: 1st order A/Cexists • Statistics: This value is always btw 0 and 4 • Two-tail test for first order A/C
Durbin-watson test • When conducting the test with significance level a, you will be given dL,α and dU,α • If 0<d< dL,α, there is statistical evidence that the error terms are positively autocorrelated. • If 4-dL,α<d <4, there is statistical evidence that the error terms are negative autocorrelated • If dU,α<d <4-dU,α, there is no statistical evidence for first autocorrelation • If dL,α < d < dU,α or 4-dU,α< d < 4-dL,α , the test is inconclusive.
Durbin-watson test • Hwk 18 Q3 • Suppose that you want to investigate inflation in the US for the past five years and you run a regression of annual inflation on annual GDP. You decide to check the results for autocorrelation. The residuals from the regression are printed below. • Year Residual • 2000 2 • 2001 3 • 2002 1 • 2003 -2 • 2004 -4
Durbin-watson test • (3-2)^2+(1-3)^2+(-2-1)^2+(-4-(-2))^2=18 • 2^2+3^2+1^2+(-2)^2+(-4)^2=34 • So, d=18/34=0.529412
Durbin-watson test • Hwk 18 Q5 • Look at the example starting on page 87 (slide 18) of the course packet. You want to know how the weather affects ticket sales at a ski resort. You have data on tickets sold and total snowfall and average temperature over Christmas week for 20 consecutive years. • Run a multiple regression of ticket sales on snowfall and temperature and answer the following questions.
multi-collinearity • Course packet slide 26, page 89 • Multi-collinearity exists when independent variables, included in the same regression, are linearly correlated to one or another. • This problem is considered serious when absolute value of corr. coef. between any pair of independent variables exceeds 0.8. i.e. |r|>0.8.
multi-collinearity • HWK 19 Q1 • Multicollinearitycan best be described as the condition in which the: independent variables in a regression have a high degree of correlation with one another. • Multicollinearityis likely to be causing problems with your regression results if: • the Overall Model F-test indicates a valid model but the individual t-tests indicate none of the independent variables are linearly related to the dependent variable • the independent variables have one or more correlation coefficients above .80
multi-collinearity • HWK 19 Q1 • Multicollinearity can result in: • an inability to interpret the estimates of the slope coefficients • an increased standard error of the individual slope coefficients • an increased p-value for the individual t-tests • a decrease in the absolute value of the individual t-test test statistics
multi-collinearity • HWK 19 Q3 • This question is related to the example on pages 98-100 (slides 63-69) of your course packet. A real estate agent is interested in estimating the value of a piece of lake front property. He believes that price is a function of Lot Size (1000s of square feet), Number of Mature Trees on the Lot, and Distance to the Lake (in yards). He has collected data on the basis of recent sales, which is provided here.