Download
1 / 19
200 likes | 408 Views
$30,000. High Income, Low Educational Attainment. High Income, High Educational Attainment. CT. State New Economy Index (2002). Top Tier. Middle Tier. NJ. Low Tier. MA. MD. $25,000. CO. VA. NH. NY. DE. MN. IL. WA. CA. AK. Personal Income Per Capita, 2000. NV. MI. RI. US.

E N D
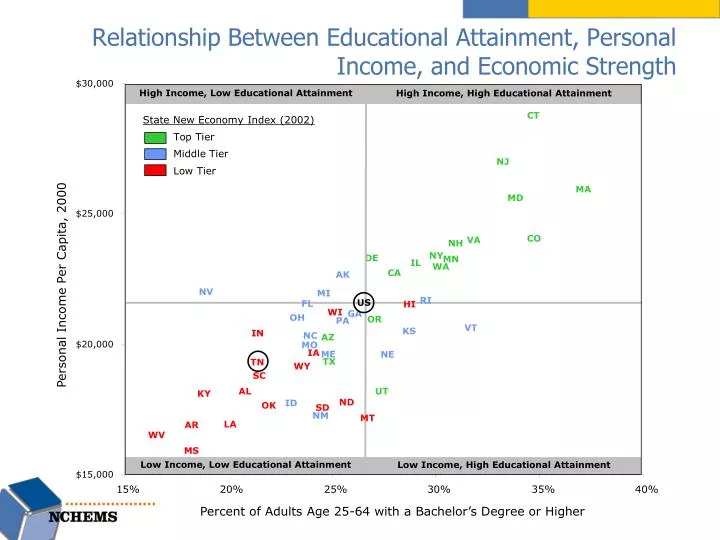
$30,000 High Income, Low Educational Attainment High Income, High Educational Attainment CT State New Economy Index (2002) Top Tier Middle Tier NJ Low Tier MA MD $25,000 CO VA NH NY DE MN IL WA CA AK Personal Income Per Capita, 2000 NV MI RI US FL HI WI GA OH OR PA VT KS IN NC AZ $20,000 MO IA ME NE TX TN WY SC AL UT KY ND ID OK SD NM MT LA AR WV MS Low Income, Low Educational Attainment Low Income, High Educational Attainment $15,000 15% 20% 25% 30% 35% 40% Percent of Adults Age 25-64 with a Bachelor’s Degree or Higher Relationship Between Educational Attainment, Personal Income, and Economic Strength
Relationship Between Educational Attainment, Personal Income, and Economic Strength
Educational Attainment and Rank Among States Tennessee, 2006 (Percent) 28th 38th 48th 42nd 40th Source: U.S. Census Bureau, 2006 ACS
Percent of Civilians Age 25-64 Not Participating in the Workforce by Education Attainment, 2005 U.S.Tennessee Less than High School 37.0 45.2 High School 24.7 25.9 Some College 21.0 21.3 Associate Degree 17.4 16.9 Bachelor’s Degree 16.5 17.5 Graduate/Prof. Degree 13.9 13.1
Percent of Adults with an Associate Degree or Higher by Age Group - Tennessee, U.S. & Leading OECD Countries Source: OECD, Education at a Glance 2008
Percent of Population Age 25-64 with an Associate Degree or Higher, 2006 Source: U.S. Census Bureau, 2006 ACS
Of 100 9th Graders, How Many… Student Pipeline, 2006 Sources: (1) Tom Mortenson, Postsecondary Opportunity; Chance for College by Age 19. (2) NCES, IPEDS 2006 Retention Rate File and 2006 Graduation Rate File. (3) U.S. Census Bureau, 2006 American Community Survey.
The Goal: TennesseeReaching International Competitiveness by 2025 55% of Population Age 25-64 with College Degrees
How Can Tennessee Reach International Competitiveness? Current Degree Production Combined with Population Growth and Migration and Improved Performance on the Student Pipeline Measures Degrees Produced 2005-25 with Current Rate of Production Additional Degrees from Population Growth Additional Degrees from Net Migration of College-Educated Residents Reaching Best Performance in High School Graduation Rates by 2025 Reaching Best Performance in College-Going Rates by 2025 Reaching Best Performance in Rates of Degree Production per FTE Student Total Degrees Produced 2005-25 If All of the Above Degrees Needed to Meet Best Performance (55%) Pipeline is cumulative Source: 2005 ACS, PUMS
1,333,645 893,504 Even Best Performance with Traditional College-Age Students at Each Stage of the Educational Pipeline Will Leave Gaps in More than 30 States In order to reach international competitiveness by 2025, the U.S. and 32 states cannot close the gap with even best performance with traditional college students. They must rely on the re-entry pipeline—getting older adults back into the education system and on track to attaining college degrees.
Collective Cost to Tennessee, AssumingTuition Stays the Same $1.06 Billion = Annual Costs of Additional Students at Current $ per Student $1.51 Billion = Current State Contribution 70% = Percent Increase in Annual State Support Needed
Average Cost to Students, AssumingNo Additional State Investment $4,245 = Additional Annual Costs to Students at Public Four-Year Institutions 94% Increase in Tuition and Fees (Currently $4,531) $2,249 = Additional Annual Costs to Students at Public Two-Year Institutions 120% Increase in Tuition and Fees (Currently $1,882)
Performance Relative to Funding: Bachelors Degrees Awarded per 100 FTE Undergraduates (Public Research Institutions) Performance (2006-07) Total Funding per FTE (2006-07) Source: NCES, IPEDS
Performance Relative to Funding: Bachelors Degrees Awarded per 100 FTE Undergraduates (Public Bachelors and Masters) Performance (2006-07) Total Funding per FTE (2006-07) Source: NCES, IPEDS
Performance Relative to Funding: All Credentials Awarded per 100 FTE Undergraduates (Public Two-Year Institutions) Performance (2006-07) Total Funding per FTE (2006-07) Source: NCES, IPEDS
Higher Education Revenues Tennessee Higher Education Commission