Download
1 / 26
260 likes | 375 Views
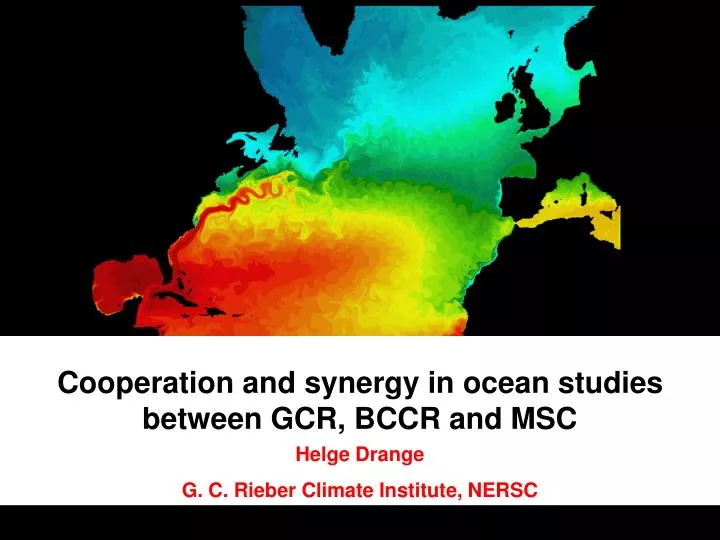
Cooperation and synergy in ocean studies between GCR, BCCR and MSC. Helge Drange G. C. Rieber Climate Institute, NERSC. Outline. Bjerknes Centre G. C. Rieber Climate Institute GCR/BCCR MSC MSC GCR/BCCR. University of Bergen Geophysical Institute Dept. of Earth Science

E N D
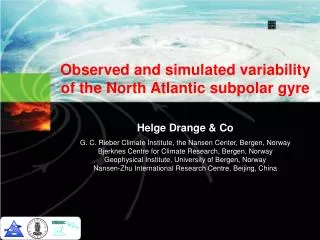
Cooperation and synergy in ocean studies between GCR, BCCR and MSC Helge Drange G. C. Rieber Climate Institute, NERSC
Outline • Bjerknes Centre • G. C. Rieber Climate Institute • GCR/BCCR MSC • MSC GCR/BCCR
University of Bergen • Geophysical Institute • Dept. of Earth Science • Dept. of Geography • Dept. of Botany Nansen Environmental and Remote Sensing Center Institute of Marine Research The Bjerknes Collaboration 1999-2000
2002-10 • University of Bergen • Geophysical Institute • Dept. of Earth Science • Dept. of Geography • Dept. of Botany Nansen Environmental and Remote Sensing Center Institute of Marine Research The Bjerknes Collaboration 2002 1999-2000
Research Infrastructure • Climate time series • Climate modelling & supercomputing facilities • Ocean research vessels • Laboratories/measurement systems • Alpine research station • Expertise • Physical oceanography • Chemical oceanography • Paleoclimatology • Global/regional climate modelling • Interdisciplinary • Bridging paleo and instrumental observations, theory and modelling of the coupled physical and geochemical climate system Resources • Staff • (Person-years) • 70in science • 10 in technical support • 4 in administration • By far the largest climate research group in Norway
Research Infrastructure • Climate time series • Climate modelling & supercomputing facilities • Ocean research vessels • Laboratories/measurement systems • Alpine research station • Expertise • Physical oceanography • Chemical oceanography • Paleoclimatology • Global/regional climate modelling • Interdisciplinary • Bridging paleo and instrumental observations, theory and modelling of the coupled physical and geochemical climate system Resources • Staff • (Person-years) • 70in science • 10 in technical support • 4 in administration • By far the largest climate research group in Norway
Core activities at GCR Climate Institute and BCCR • Past, present and future climate modelling • Coupled atmosphere-sea ice-ocean system (Bergen Climate Model) • Atmosphere and ocean only systems (ARPEGE and MICOM, respectively) • Mainly global scale modelling • Some regional scale modelling, and then with lateral boundary conditions provided by the global system
Climate modelling – academic exercise or (approaching) reality? Basic climate research Climate impact studies Where does the MSC enter the scene?
0 1 2 3 4 5 6 7 8 9 10°C Sea surface temperature from satellite, May Greenland Norway Orvik and Niiler, GRL, 2002
Iceland Norway UK Ocean colour (SeaWifs), July 2004
The Miami Isopycnic Coordinate Ocean Model • Dynamic-thermodynamic sea ice modules included • Reference pressure at the surface • 24 model layers with potential density ranging from 23.54 to 28.10 • Stretched grids with focus in the North Atlantic-Arctic region (Bentsen et al., Mon. Wea. Rev.,1999) • Daily atmospheric forcing, using • NCEP/NCAR reanalysis data • (Kalnay et al., 1996) • • No explicit use of in situ • observations • Period 1948 to present • Integrations conducted: • - 80/40/20 km resolution • - with CFC-11, CFC-12, • 137Cs and SF6
Simulated and observed mean transports (Sv) Nilsen et al., GRL (2003), Nilsen et al., in prog. PassageDirModObsReferences DS N 0.5 1.0 Hansen & Østerhus (2000) S 4.3 4.3 HØ (2000), Fissel et al. (1988) PassageDirModObsReferences DS N 0.5 1.0 Hansen & Østerhus (2000) S 4.3 4.3 HØ (2000), Fissel et al. (1988) IFR Net 2.2 2.3 HØ (2000) PassageDirModObsReferences DS N 0.5 1.0 Hansen & Østerhus (2000) S 4.3 4.3 HØ (2000), Fissel et al. (1988) IFR Net 2.2 2.3 HØ (2000) FSC N 4.3 4.4 Orvik & Skagseth (2003) S 2.2 2.6 HØ (2000), Turrel et al. (1988), Østerhus et al. (1999), Ellett (1998)
Observations (seasonal cycle and averages removed) Model Model Temperature Salinity Rockall Through temp (0-800 m) Hátun/Sandø (2004)
vs. simulated Gao et al., in prep. (2004) Observed variability Orvik and Skagseth, GRL (2004) Observed transport 7 days low pass Transports along Norwegian continental slope =Inflow through FSC
Changing potential energy difference between the extratopical, A and subpolar gyre B (Curry and McCartney, 2001) Changes in the average curlzt, (Orvik and Skagseth, 2003) *B curlzt=0, i.e.vanishing Sverdrup transport Discontinuous latitude of the North Atlantic Current (Bower et al., 2002) *A Upstream effects on the northward flowing Atlantic water
Conceptual scheme curlzt>0 1. Norw. Sea Atlantic 2. As this baroclinic currentencounters the European continental slope, a conversion to a barotropic slope current, the NwASC, takes place Orvik and Skagseth, GRL (2003)
Release point Transport & dispersion of 137Cs from the Sellafield reprocessing plant 137Cs ObservationKershaw & Baxter (1995) Gao et al. (2004)
Observed and simulated concentration of 137Cs in the Barents Sea 5 yr Solid line Simulated atm. fallout + Sellafield 137Cs Dotted line Simulated atm. fallout of 137Cs Circles Observed 137Cs Gao et al. (2004) Obs: Kershaw og Baxter (1995)
Observed and simulated 0-250 m temperature in the Barents Sea (Kola Section) Red line Observed T Black line Simulated T Gao and Drange, in prep. (2004)
Climate modelling – academic exercise or (approaching) reality? Approaching reality! Unexploited potential for bridging ocean climate observations and models to describe and to understand observed fluctuations in the marine climate system Next step is to use data assimilation systems to further improve the simulations; global boundary conditions are available; dynamic interpretation of observed and simulated anomalies are emerging
What will the climate of Europe be like in 2020? Greenland • Coupled climate models suggest the answer may be quite sensitive to the present state of the Atlantic Meridional Overturning Circulation • More research needed to • Better observe the Atlantic MOC • Better understand how current state of the Atlantic MOC constrain its future evolution
The importance of decadal climate prediction Greenland • ‘Forecasting’ of climate change has focused on time horizons of 50-100 years • The longest time horizon considered in strategic planning are generally much shorter: 1-30 years
From Predicate (EC FP5) The evolution of the strength of the Atlantic MOC is relatively stable to perturbations to the system Collins et al. (2004)
From Predicate (EC FP5) In general positive coefficient of regression (K per Sv) over northern Northern Hemisphere Collins et al. (2004)
From Predicate (EC FP5) Proper 3-D ocean initial state is needed for properly addressing decadal scale climate prediction Collins et al. (2004)
Great potential for collaboration and interaction between G. C. Rieber Climate Institute, the Bjerknes Centre and the Mohn-Sverdrup Centre