Download
1 / 21
240 likes | 374 Views
Carbon sequestration due to the abandonment of croplands in the former USSR since 1990. Nicolas VUICHARD (1) Luca BELELLI (1) Irina KURGANOVA (2) Philippe CIAIS (3) Pascalle Smith (3) Riccardo VALENTINI (1) University of Tuscia – Viterbo (Italy)

E N D
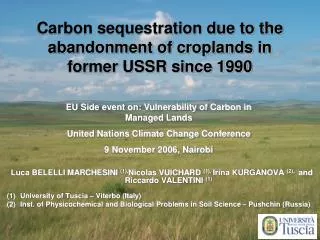
Carbon sequestration due to the abandonment of croplands in the former USSR since 1990 Nicolas VUICHARD(1) Luca BELELLI (1) Irina KURGANOVA (2) Philippe CIAIS (3) Pascalle Smith (3) Riccardo VALENTINI (1) University of Tuscia – Viterbo (Italy) Inst. of Physiochemical and Biological Problems in Soil Science – Pushchin (Russia) (3) LSCE/IPSL – Saclay (France)
General overview • Soil carbon changes are impacted by + Climate + Climate ++ Management (harvest, tillage, fert.) + Climate ++ Land-use legacy Soil carbon Climaxic ecosystem grassland agriculture recovering grassland time 50’s 90’s
Cropland’s abandonment • Due to 1990’s economic crisis, important area of arable land has been abandoned Arable and permanent crops in CIS (former USSR) source FAOSTAT - 20 Mha Abandoned cropland areas from 1990 to 2000 (Hurtt et al., 2006)
C gain estimate from plot to regional scale Data-based precise estimates Model-based uncertain estimate At the plot scale Ecosystem modeling associated with climatology and land-use change scenarios Soil carbon inventories Flux measurements At the regional scale Easy to extrapolate estimate Difficult to extrapolate estimate
Eddy-Flux measurements Years after land-use change 5 years 10 years more than 100 years Hak 3 Cultivated from 1958 to 1993 NEE: -146 gC m-2 yr-1 Hak 1 natural steppe NEE: -113.5 gC m-2 yr-1 Hak 2 Cultivated from 1958 to 1998 NEE: -201 gC m-2 yr-1 Flux data from Belelli Years after land-use change Hak1 Hak3 NEE anomaly with Hak1 (gC m-2 yr-1) Hak2
Soil carbon inventories Carbon accumulation in soils of abandoned croplands C accumulation (tC ha-1) Carbon balance of abandoned land Years after land-use change NEE (gC m-2 yr-1) Years after land-use change
Soil carbon inventory based regional estimate Abandonned land (Mha) NEE (TgC yr-1) C gain : 131 TgC from 1993 to 2000 over 21.5 Mha
Assessment of a model-based regional estimate Generic Crop Model LUE growth Biomass allocation and yield Water and Nitrogen balance No soil C balance scale : field / seasonal cycle wheat maize soybean • By using Orchidee-Stics Krinner et al. (2005) Terrestrial Biosphere Model Natural ecosystem functioning + disturbances scale : local => regional => global 1 year => 1000 years Gridded climate and soil forcing Brisson et al. (2002) LAI
Scenario • Simple land-use change scenario Orchidee grassland agriculture recovering grassland Orchidee Orchidee-Stics time 1951 1993 2000 Model improvements for steppes • Modification of photosynthetic parameters values • Changes in the allocation scheme LAI data retrieved from FAPAR product (JRC-ISPRA) Flux data from Belelli et al. (submitted)
Scenario • Simple land-use change scenario Orchidee grassland agriculture recovering grassland Orchidee Orchidee-Stics time 1951 1993 2000 • C export management • Harvest = grains + straw • > We export all the harvested biomass out of the field • Tillage -> few information on intensity • > We assume that tillage induces a 30% decrease of the residence time of the soil carbon • N-fertilizer addition • statistics from USDA • (on arable land of former USSR)
Results cropland 1993 2000 1993 2000 recovering grassland 1993 2000 Spatial mean annual NEE 537.2 gC m-2 NEE (gC m-2 yr-1) Croplands 100% instant. aband. Croplands 100% instant. aband. Realistic aband. scenario Abandonment of cultivation Map of the C gain from 1993 to 2000 per m2
Results (2) C gain from 1993 to 2000 per m2 Map of the C gain from 1993 to 2000 C gain : 92 TgC in 8 years over 17 Mha Abandoned cropland area from 1993 to 2000 • No fertilization during cultivation => +6.1% • No tillage (no impact on soil decomposition) => -5.4% • 10% of straw remains on plot => -12.7%
Estimates comparison and 2000-2010 prediction • C gain between 1993 and 2000 • Extrapolation for the period 2001-2010 Model-based estimate 116 TgC in 8 years over 21.5 Mha Data-based estimate 131 TgC in 8 years over 21.5 Mha Data-based estimate 217 TgC in 10 years over 22.8 Mha
Conclusions • Good agreement between our 2 regional estimates • The abandonment of crops leads to a substantial gain of C • Improvements can be done • model approach • To better quantify the management practices • data approach • To obtain C accumulation for the first years after land-use change
Thank you ! Acknowledgments to: Hurtt et al. (global land-use change map) FAPAR team from JRC-ISPRA
Assessment of the amount of carbon sequestered • At the plot scale • At the regional scale Flux study based on eddy-covariance measurements Soil carbon inventory-based studies Soil carbon data derived estimate Estimate based on ecosystem modeling with land-use change scenarios
EC based estimate Annual NEP (gC m-2 y-1) Flux data from Belelli
Scenario • 80% of the abandoned croplands are located between 20°-40°E and 40°-60°N • Simple land-use change scenario • Region of interest grassland agriculture recovering grassland time 1951 1991 2000 Abandoned cropland areas from 1990 to 2000 (Hurtt et al., 2006)
Model improvements for steppes • On the Hak1 site (54.5°N 90°E) • Modification of photosynthetic parameters values • Changes in the allocation scheme LAI data retrieved from FAPAR product (JRC-ISPRA) Flux data from Belelli et al. (submitted)
Hypothesis / Simplification • Fertilization • C export management of croplands • Harvest = grains + straw • > We export all the harvested biomass out of the field • Tillage -> few information on intensity • > We assume that tillage induces a 30% decrease of the time of residence of the soil carbon • statistics from USDA (1965-1985 on arable land of former USSR)
Assessment of a regional estimate Agricultural practices Vegetation map Gridded climate/soil forcing Generic Crop Model LUE growth Biomass allocation and yield Water and Nitrogen balance No soil C balance scale : field / seasonal cycle wheat maize soybean Irrigation LAI Nitrogen stress index Vegetation height • By using Orchidee-Stics mechanistic model Krinner et al. (2005) Brisson et al. (2002) Terrestrial Biosphere Model Natural ecosystem functioning + disturbances scale : local => regional => global 1 year => 1000 years